Estonia · Eesti · Muuga, free-zone parks, Tallinn Airport

Indoor mapping & RFID tracking in Estonia, from Muuga Harbour to the electronics line

Spatial Map turns a plant, a warehouse or a terminal into a live 3D map in the browser, with racks coloured by stock, RFID-tagged pallets read at the dock and forklifts as moving markers, fed by the WMS, readers and sensors you already run. Indoor mapping & RFID tracking in Estonia suits a small, trade-minded country: a deep-water cargo harbour beside the capital, free-zone parks, an airport that ships more freight than its passenger numbers suggest, and manufacturers that live on supply-chain precision. Each building is its own facility, and one workspace holds them all.

No credit card. Runs in the browser. Pro is $60/month for up to 4 facilities. Book a demo

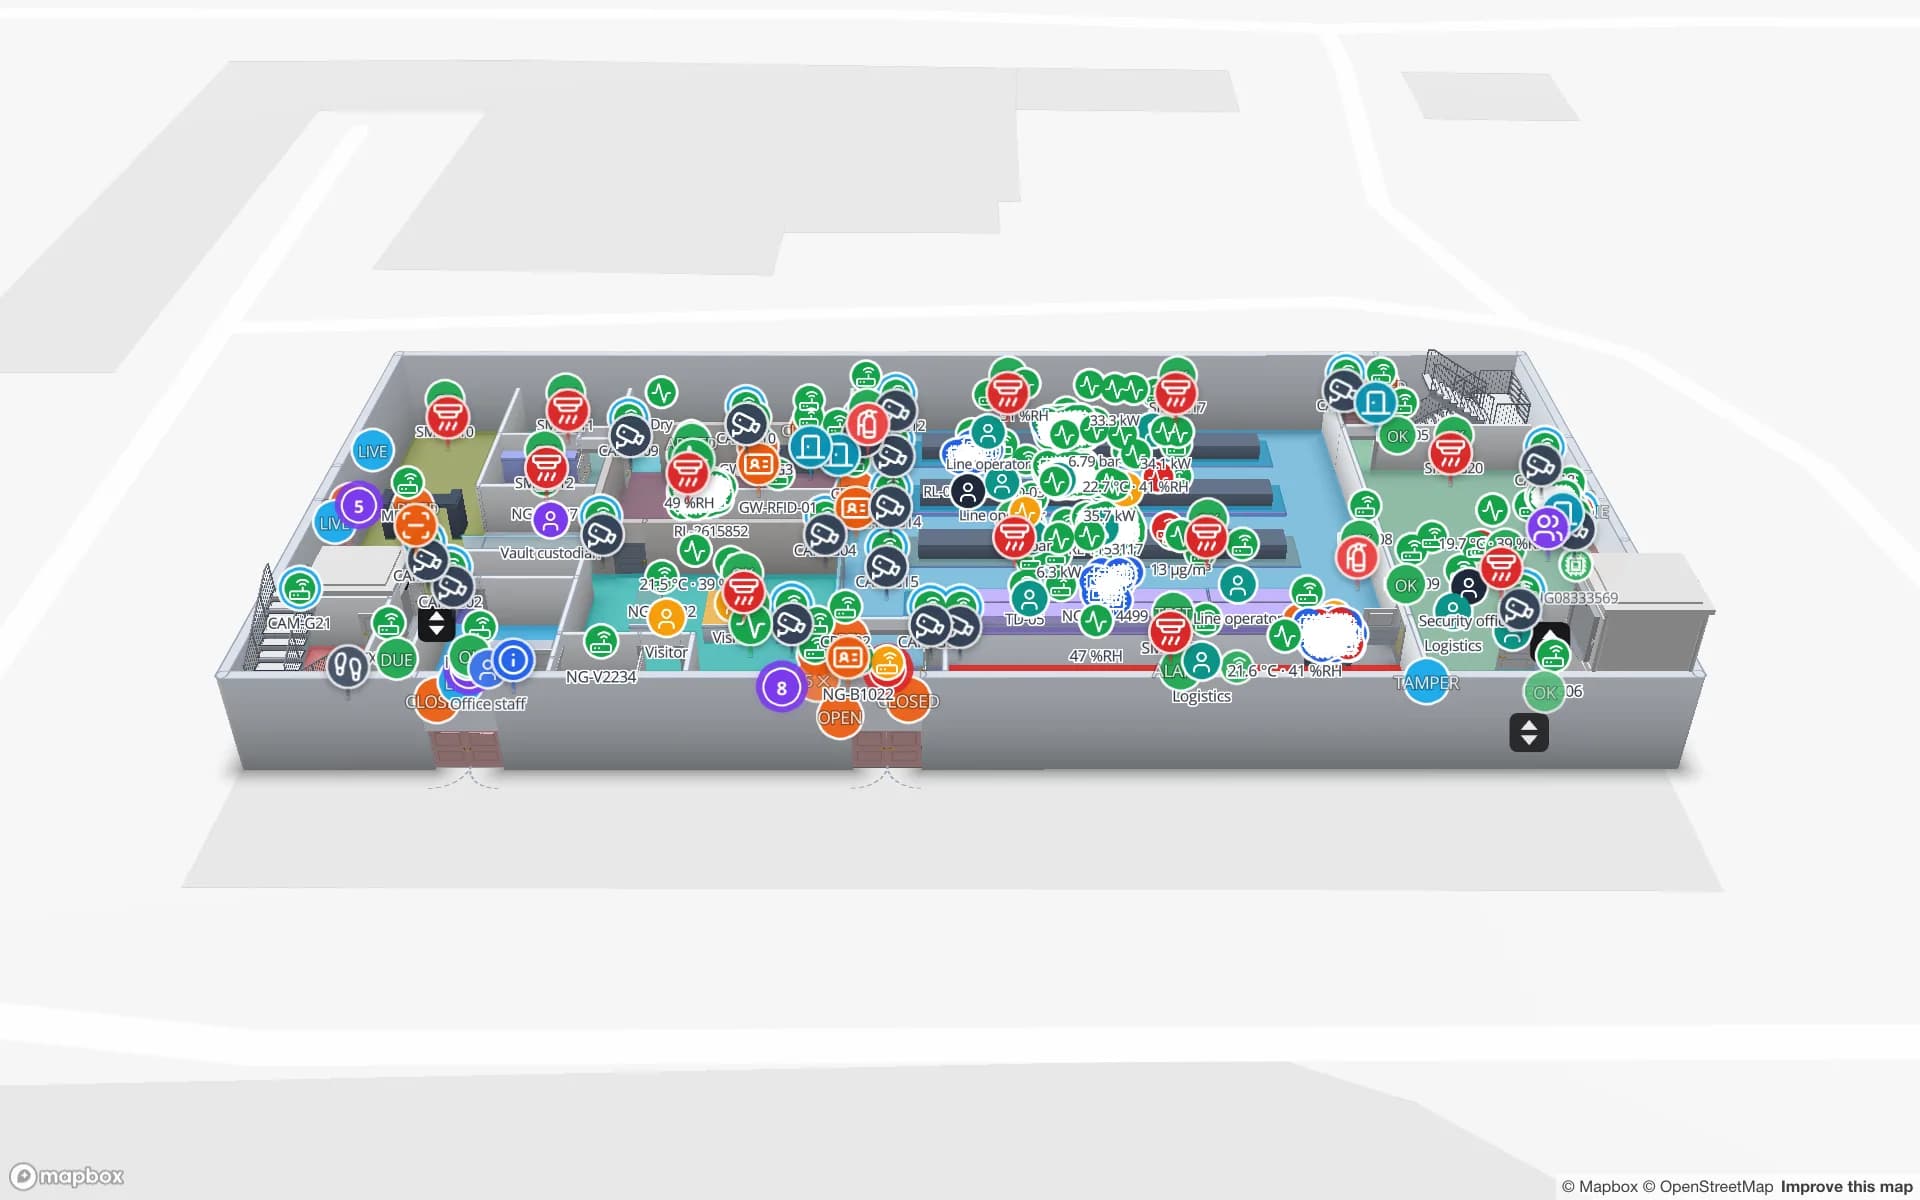
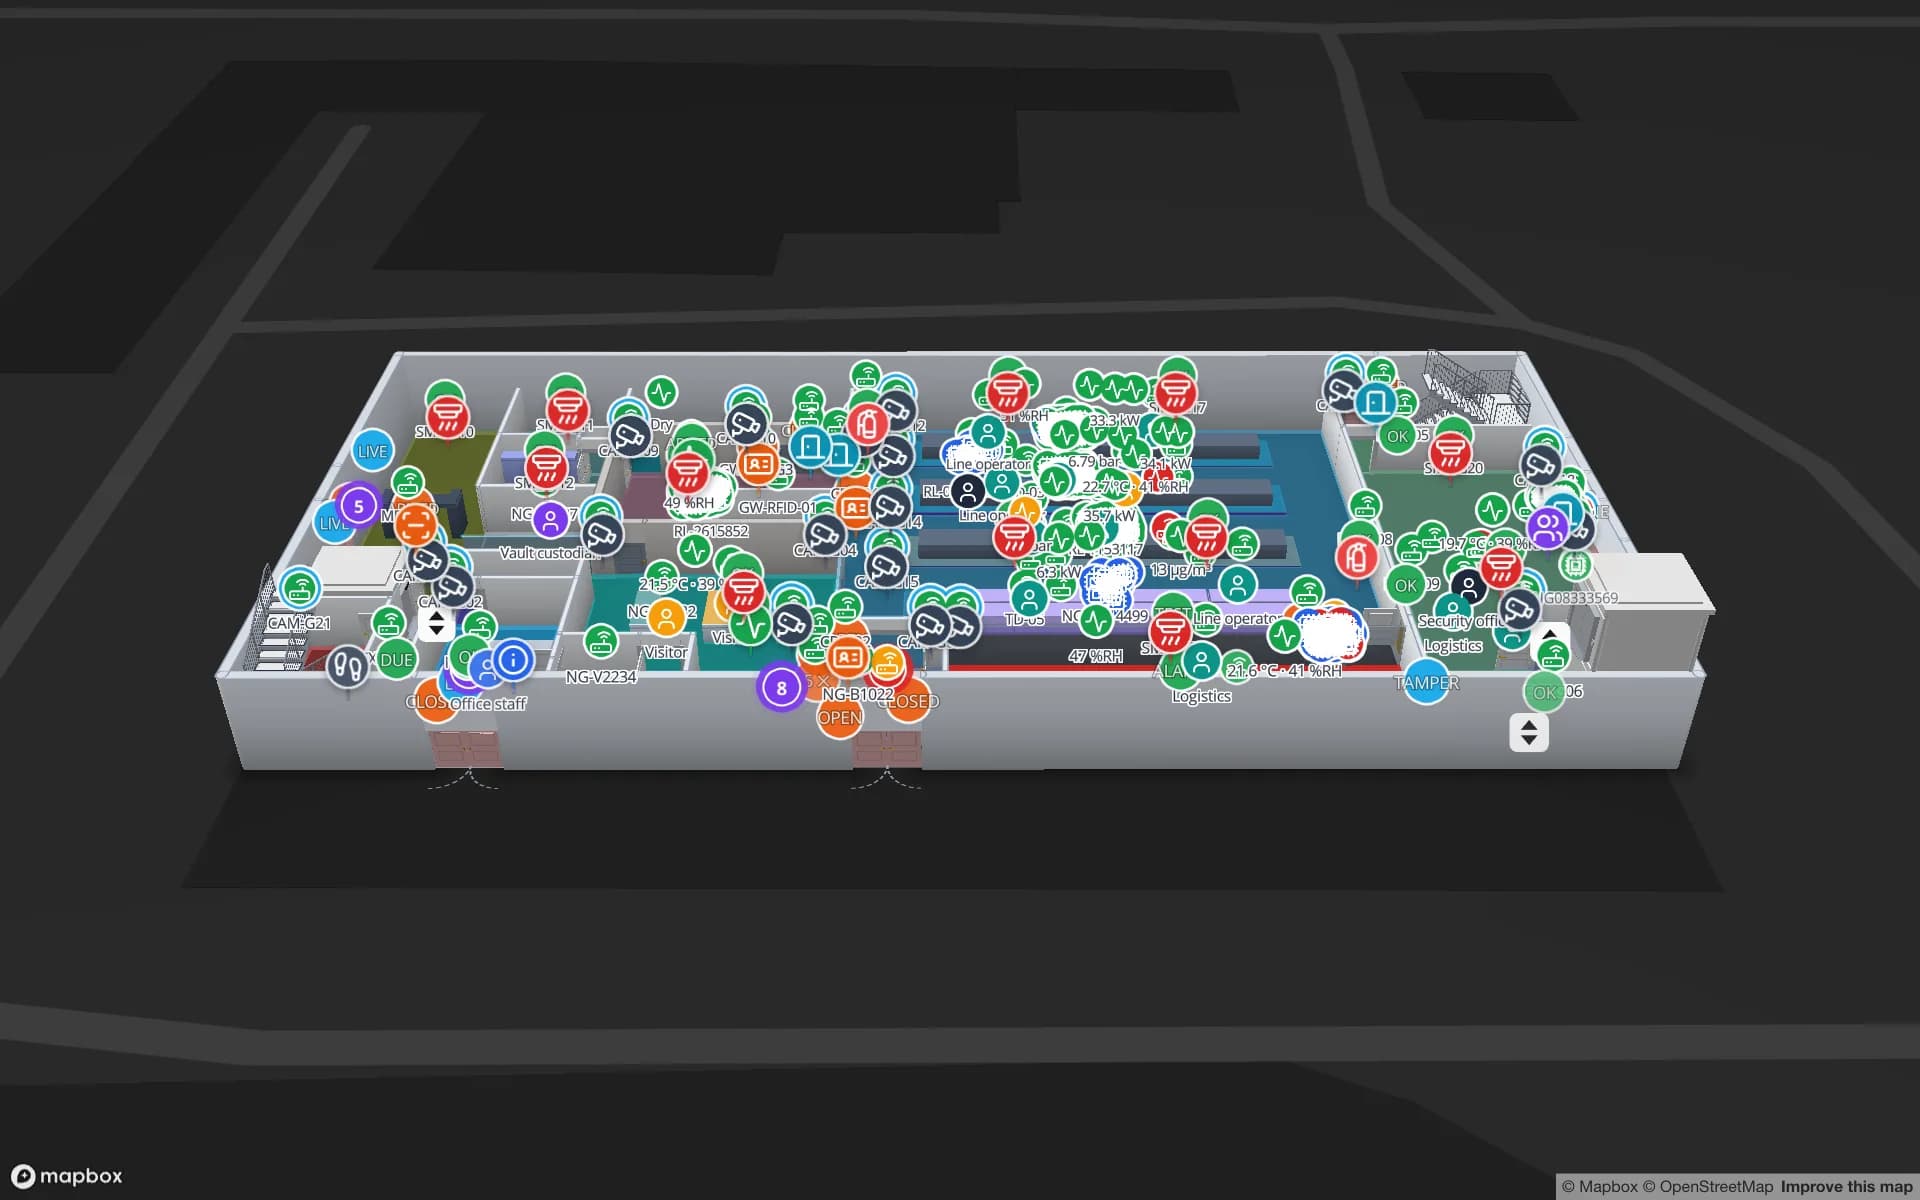
Northgate Electronics — Assembly & Secure Store, a electronics assembly & secure store demo, in the Spatial Map 3D viewer with live device markers
Northgate Electronics — Assembly & Secure Store
Northgate Electronics, a demo electronics plant with a secure store: assembly lines, a vault and cages, and RFID-tagged material moving between store and line.
Muuga Harbour territory, per the Port of Tallinn
563 ha
Air freight and mail at Tallinn Airport in 2025, per Statistics Estonia
+33 %
Interface language for Estonian teams (Estonian and Russian not available)
English
Free trial, up to 5 facilities, no card
7 days

Muuga: a cargo harbour with room to spare

The Port of Tallinn describes Muuga Harbour as a 563-hectare territory with 29 berths and 6.4 km of berth length, a maximum depth of 18 m, handling containers, liquid and dry bulk, ro-ro and general cargo. It lies next to the capital, which is why so much of the country’s freight is a short drive from a warehouse in Greater Tallinn.

Cargo that leaves the berth is stored, stuffed, unstuffed and reloaded in sheds beside the harbour and along the roads inland. A warehouse there faces the same questions as any other: which pallet is in which lane, which cartons are staged for which vessel or trailer, which door is free. A map of the building with dock doors and staging lanes, coloured from your WMS or RFID reads, answers them; the Eastport demo shows 50 dock doors, 44 yard slots and 1,180 RFID pallets on one plan. Spatial Map does not connect to port, customs or terminal systems; it shows what your own data says.


Free-zone and industrial parks: Muuga and Paldiski

Muuga Industrial Park covers 76 hectares and is a designated free zone, with simplified customs procedures according to the port. Paldiski South Harbour Industrial Park, 39 hectares on the Pakri Peninsula about 50 km west of Tallinn, offers sea, rail and road access. Parks like these tend to host processing and re-export: goods arrive, are worked on or repacked and leave again, with paperwork that depends on where each pallet is and what has been done to it.

For that kind of operation the useful question is status by location: held, in process, released, loaded. Draw the zones of the hall as areas, post one row per pallet or lot with its status, and the floor colours itself; a count rule can raise an in-app alert when a hold area fills up. This is a view for the operator. Customs records stay in your declarant’s system, and Spatial Map makes no compliance claim about them.

Tallinn Airport: freight to Leipzig and Central Asia

Statistics Estonia reports that Tallinn Airport served about 3.5 million passengers in 2025, the same as the year before, while air freight and mail rose 33 % to about 12,400 tonnes. Leipzig took about a quarter of it and connections to Kazakhstan and Uzbekistan another quarter. For a freight forwarder or a handler, a quarter of the volume heading to one cargo hub means the shed is organised by flight, with deadlines that do not move.

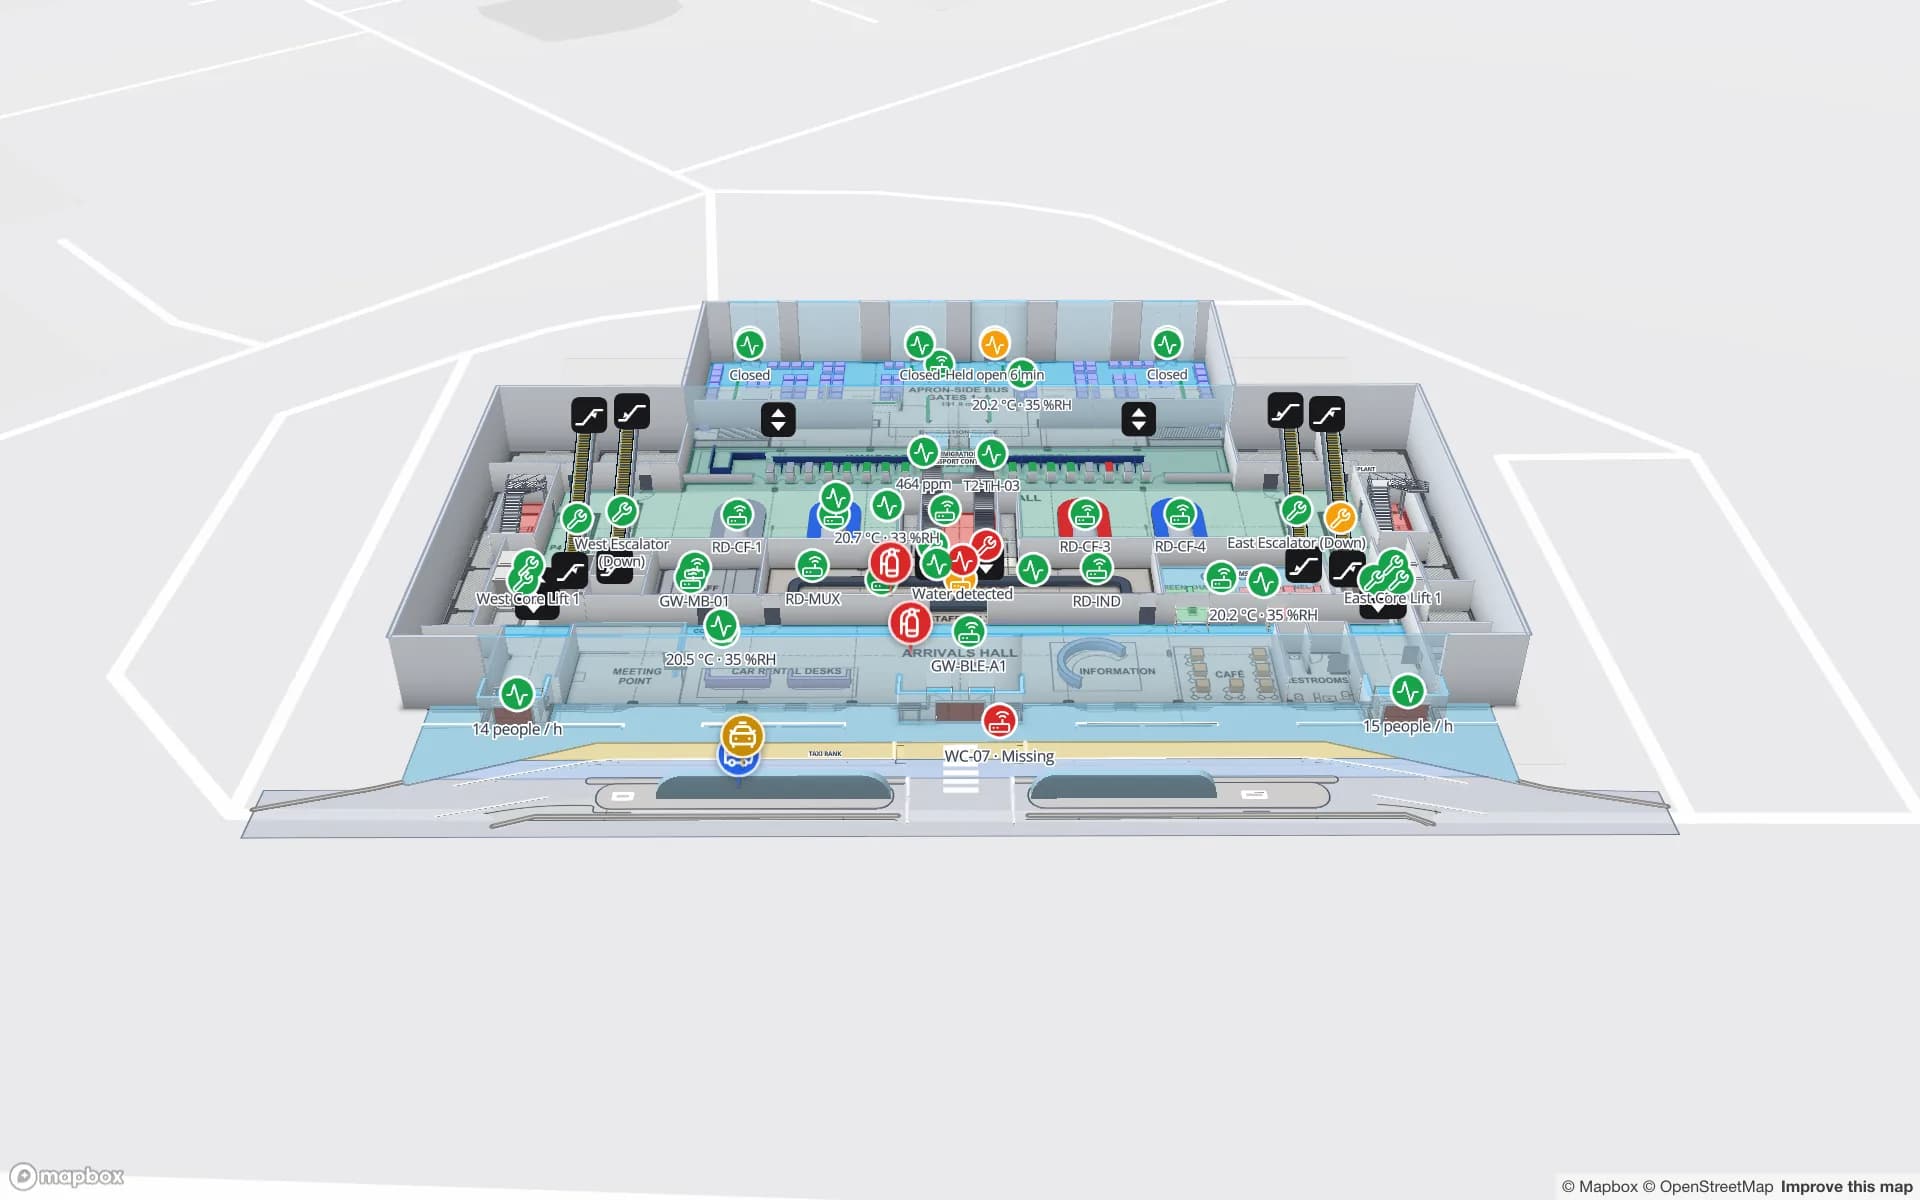
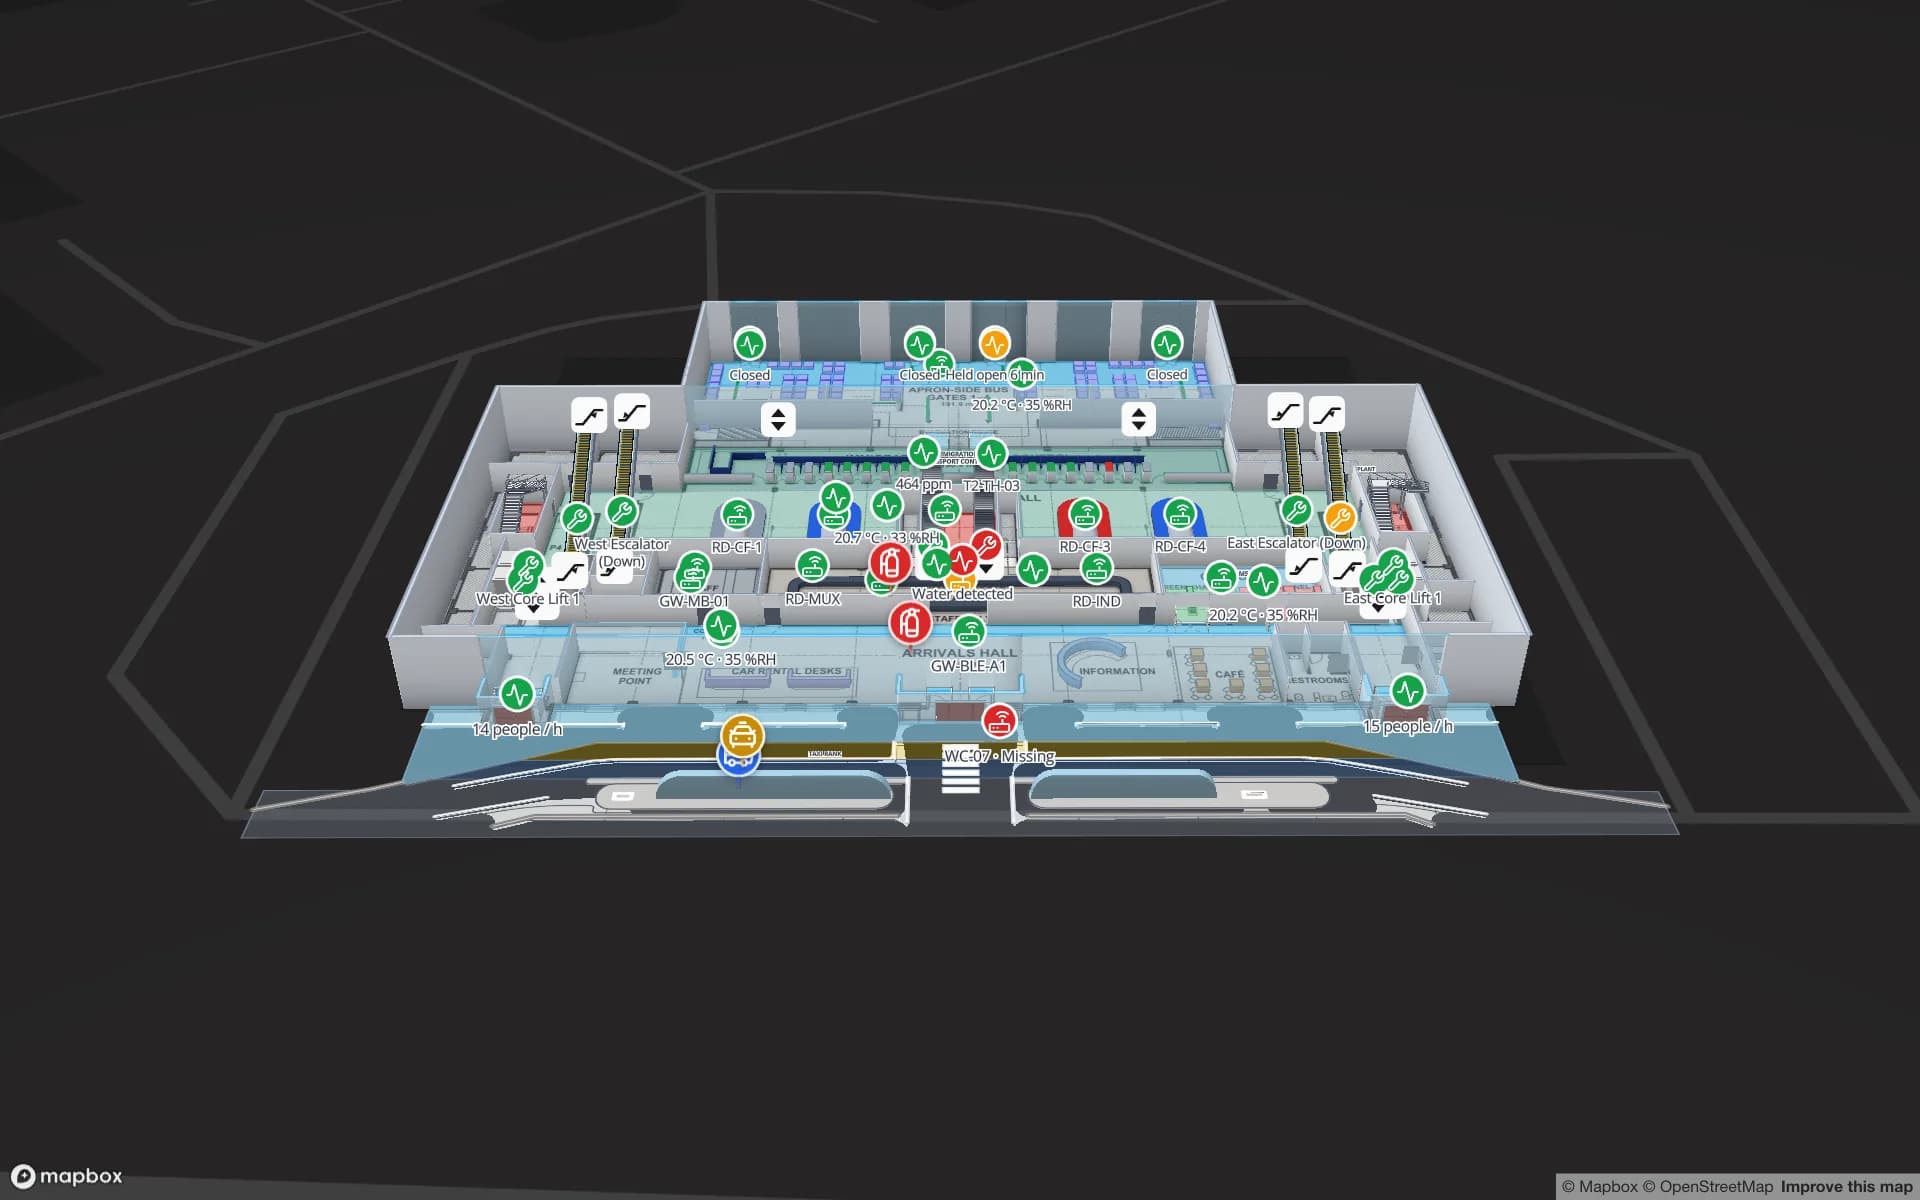
Mapping the shed as lanes named after flights or routes, with an RFID portal or a handheld read at each door, turns the cut-off into something you can see. See RFID warehouse management for portals at doors and airport indoor mapping for terminals; the Silverbay demo shows a two-floor terminal with gates, check-in and baggage reclaim.

Electronics, wood and engineering in compact plants

Economic overviews list engineering, electronics, wood products and IT among Estonia’s main industries, with electrical equipment the largest export category in its 2019 breakdown. Plants of that kind are rarely huge. They are compact halls where component stores, test areas and finished goods share a roof, and where one missing reel or carrier stops a line.

The Northgate demo shows the pattern: assembly lines and a secure store on two floors, with RFID-tagged material read as it moves from store to line. Wood processors usually care about lanes and lots rather than racks, which is a job for coloured areas. Manufacturing supply-chain visibility explains how the pieces fit.

Rail Baltica, Ülemiste and the changing freight map

Estonia’s section of Rail Baltica, the standard-gauge line meant to link the Baltic capitals with Poland, is under contract and in construction, and Tallinn’s city government has approved a plan turning 11.47 hectares at Ülemiste into a transport node around the new terminal. Dates have moved before and sources differ, so we state none. What matters for operators is that freight flows will shift and new logistics buildings will appear around the nodes.

A new building is the easiest one to map: upload the BIM or CAD export as a PDF or DWG (AutoCAD R2004–R2018, placed as a picture), and AI Map drafts walls, doors, racks and areas for a person to review. The map can exist before the first pallet does.

Language, privacy and working with us

The app is not available in Estonian or Russian. Estonian teams normally use it in English; German, French, Spanish, Arabic and Chinese complete the list of six, and each user picks their own. Room names, rack codes and report titles can be in Estonian, õ, ä, ö and ü included, and appear on the map and in reports as typed.

Under the GDPR, location data linked to employees is personal data, and in Estonia the Data Protection Inspectorate is the supervisory authority; your legal advisers decide what applies. Most projects tag pallets, carriers, tools and forklifts rather than people. A data processing agreement is available and the security page explains how data is protected.

Services for teams in Estonia

Where Estonian teams usually start depends on the building:

Also served

The same offer covers Tartu, Pärnu, Narva, Kohtla-Järve, Sillamäe and Paldiski and the industrial towns around them. Only Tallinn has its own page.

How Spatial Map does it

From plan to live map

  1. 01

    Import the plan

    Upload a PDF or DWG (AutoCAD R2004–R2018, placed as a picture) of the hall and yard; AI Map drafts racks, doors and areas for a person to review.

  2. 02

    Name lanes, racks and doors

    Use the codes your WMS or RFID middleware uses so every row lands in its place.

  3. 03

    Connect stock and reads

    CSV or Excel exports, a polled REST endpoint, or the table write API for bulk upserts.

  4. 04

    Alert and report

    In-app alerts for late pallets or silent readers, History playback, and reports to PDF or Excel.

What Estonian teams use it for

Port warehouses and forwarders

Dock doors, yard slots and pallets staged for the right vessel or trailer.

Electronics and engineering plants

Components and WIP carriers between store and line.

Air-freight sheds

Lanes by flight with RFID reads at each door.

Distribution centres

Rack-level stock by bin, pick zones and staging lanes.

See it on real demo facilities

Fictional names, real floor plans, live sensors, RFID, BLE tags and gateways — open any of them in the browser.

All 13 demo facilities

Questions from Estonian teams

No. The app is available in English, German, French, Spanish, Arabic and Chinese, and each user picks their own language. Your own content — rack codes, room names, report titles — can be in Estonian or Russian.

No. It shows what happens inside your own building from your own WMS, RFID reads and sensors. Data comes in through REST polling, file uploads (CSV, Excel, JSON, GeoJSON) or the table write API, and nothing is written back.

Yes. They can push rows through the write API (HTTPS, bearer API key, bulk upsert, 60 requests per minute per key) or expose a REST endpoint that Spatial Map polls. If you prefer, our team builds integrations as client projects.

Yes. DWG files from AutoCAD R2004–R2018 are placed as a picture at real-world units and PDFs are scaled from standard sheet sizes. DXF is not supported; export a PDF or DWG instead.

No. Spatial Map is sold online and our team works with customers in Estonia remotely, by video call and through the contact form. There are no local resellers or partners.

No. Pricing is the same worldwide and in US dollars: a 7-day free trial for up to 5 facilities with no card, then Pro at $60 a month or $600 a year for up to 4 facilities. Hardware, if you ask us to source it, is quoted per project.

Map your first Estonian plant or warehouse this week.

Start the free trial and open the demo plants, or send us a hall layout and a sample of your stock export through the contact form.