Rosario · Up-River terminals, crushing plants and Puerto Rosario

RFID tracking in Rosario, from the truck queue to the barge berth

Spatial Map puts RFID reads on a live 3D map of the plant where they happen, so a tag at a gate lane becomes a truck waiting at a weighbridge, a tool leaving the workshop or a container in a yard slot. RFID tracking in Rosario starts on the river: the Greater Rosario port complex is the country’s grain gateway, and every terminal and crushing plant on it is a building that can carry its own map. Your readers and middleware do the reading; Spatial Map shows each read in place.

No credit card. Runs in the browser. Pro is $60/month for up to 4 facilities. Book a demo

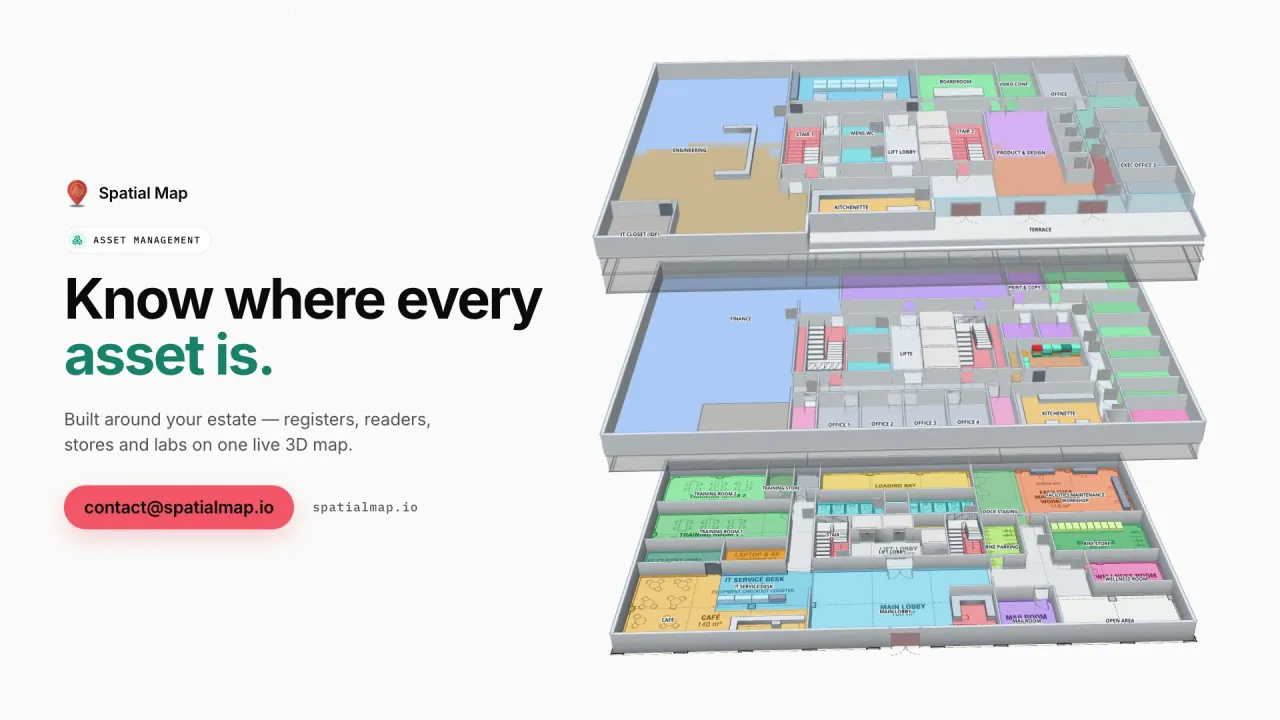
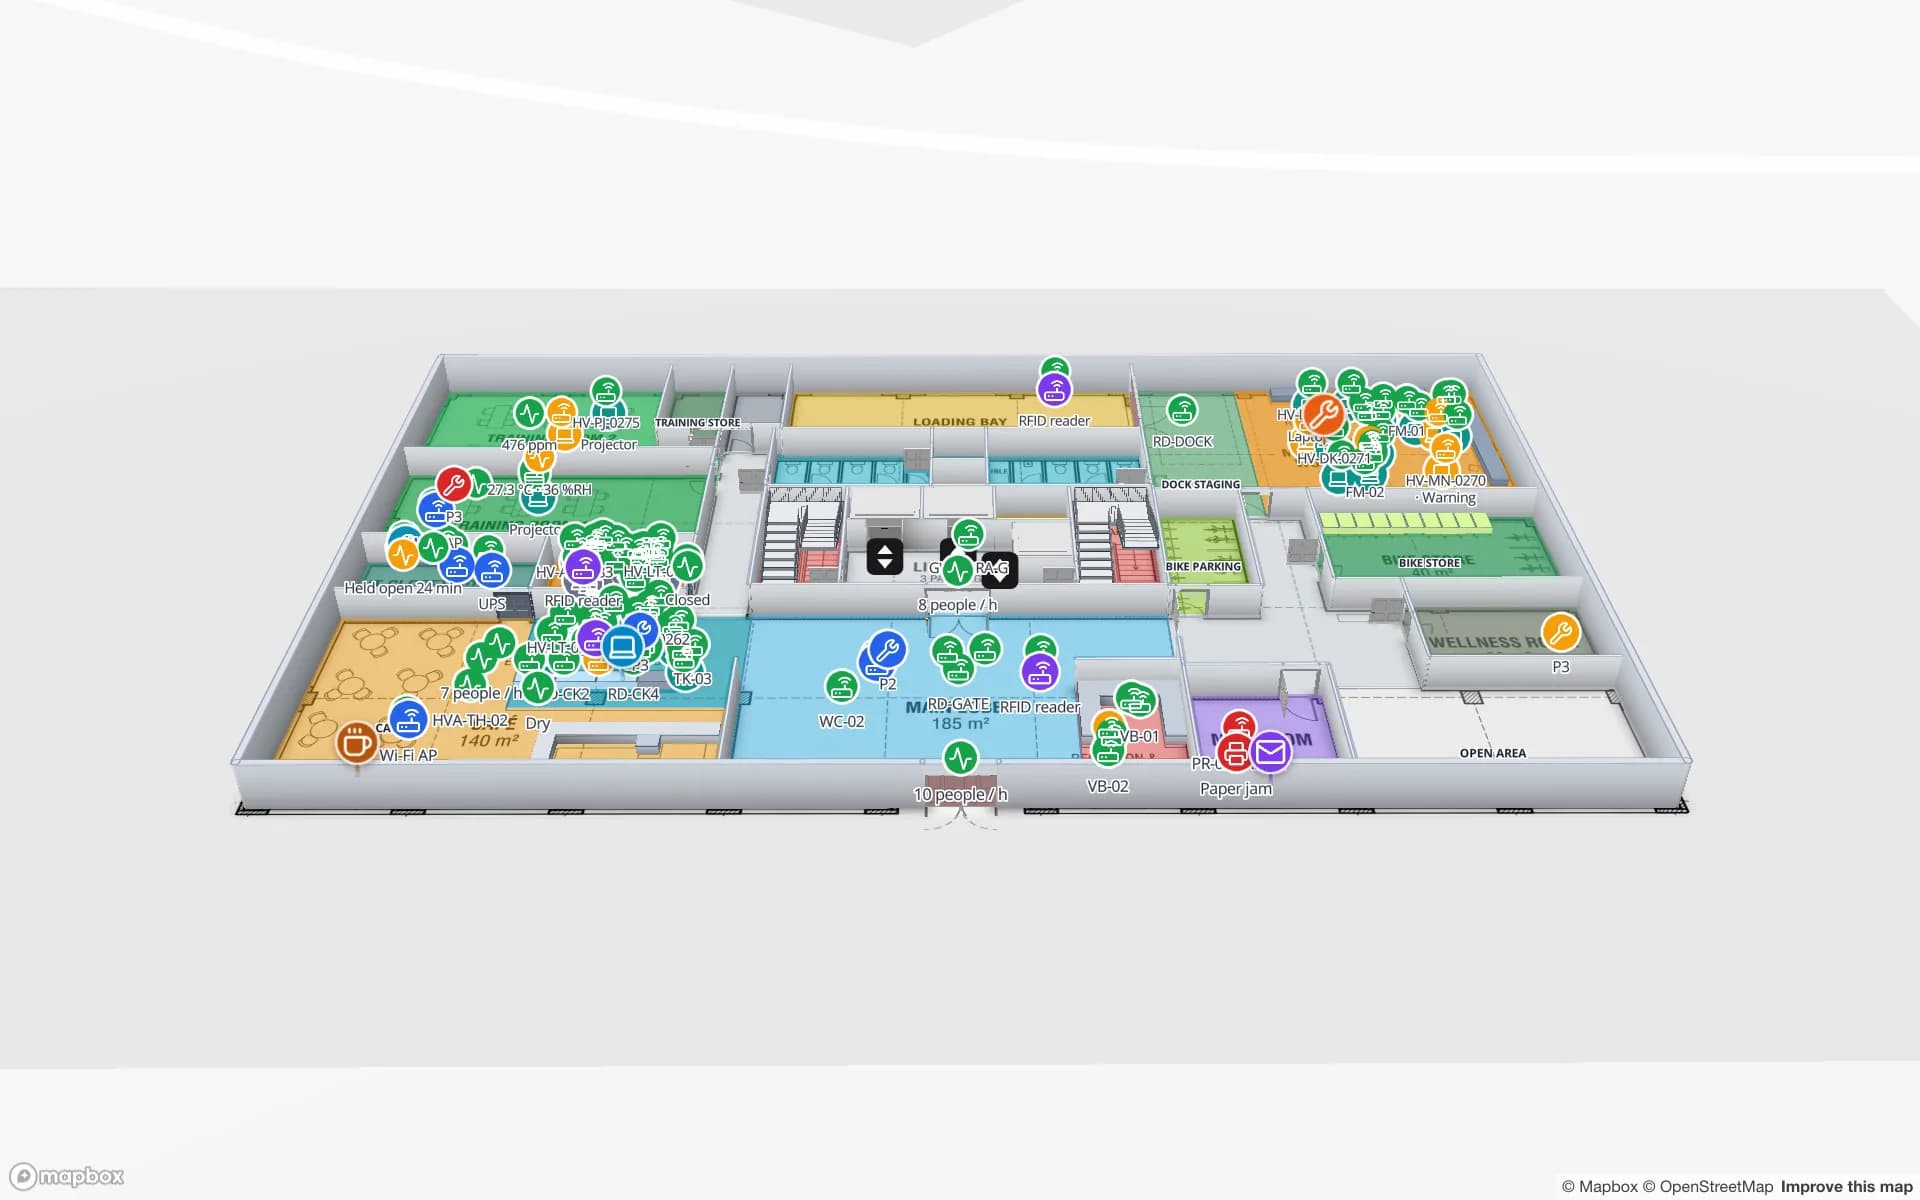
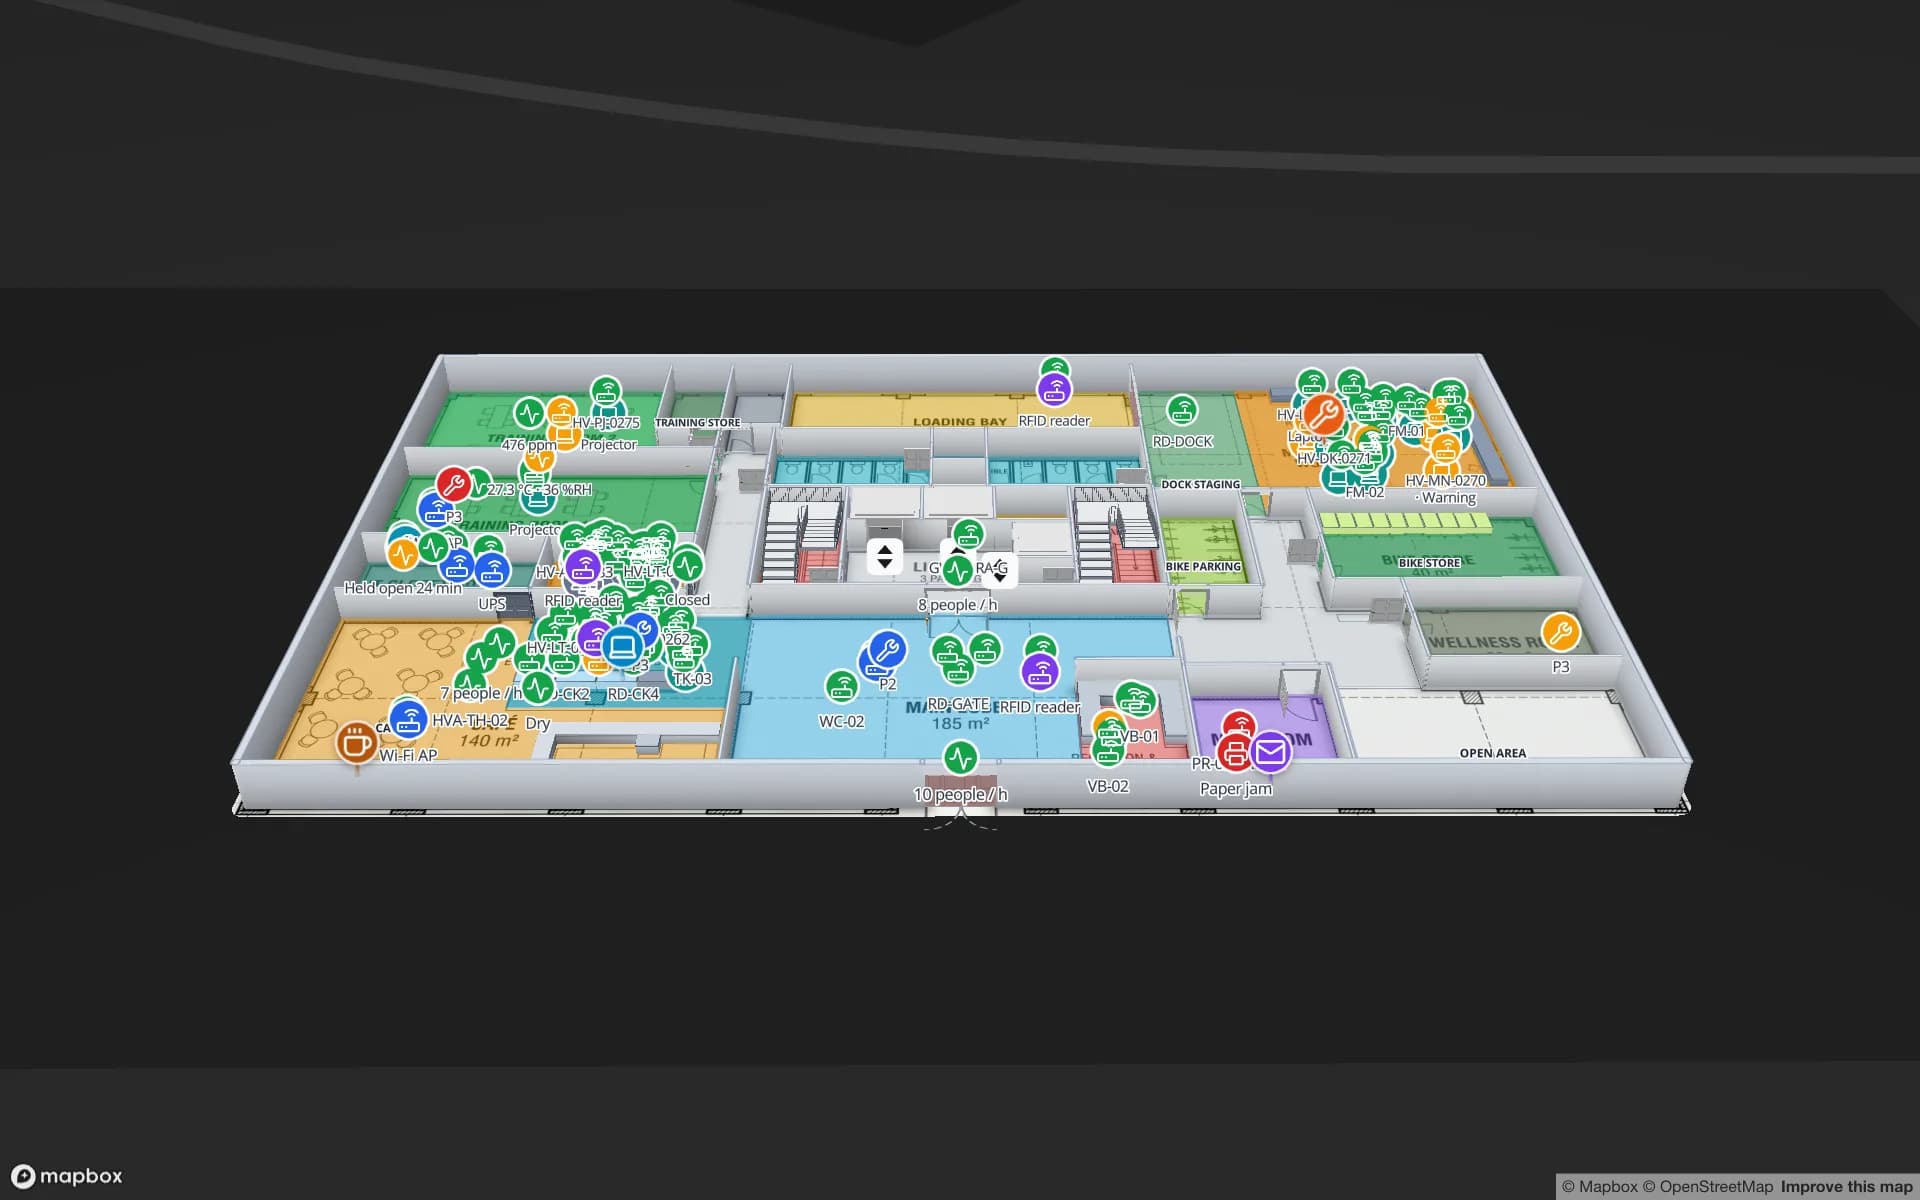
Eastport Cross-Dock Freight Hub, a cross-dock & trailer yard demo, in the Spatial Map 3D viewer with live device markers
Eastport Cross-Dock Freight Hub
Eastport Cross-Dock, a demo freight hub: 50 dock doors, 44 yard slots and 1,180 RFID pallets, with the gate lanes and weighbridges.
Yard slots in the Eastport cross-dock demo
44
RFID pallets moving through Eastport
1,180
How often alert rules are checked, with alerts shown in the app
15 s
Free trial, up to 5 facilities, no card
7 days

Seventy kilometres of river, thirty terminals

The Rosario Board of Trade (BCR) describes Greater Rosario as a 70-kilometre stretch of the Paraná from Timbúes to Arroyo Seco, with 30 port terminals, 18 of them handling agro-industrial products, and says the Up-River region shipped 75.7 million tonnes of grains, oils and by-products in 2025. An earlier BCR survey, reported in February 2020, counted 20 soybean and sunflower processing plants in the area, 12 of them with their own port facilities, and 13 terminals with barge berths.

A plant like that is a small town: gate lanes, weighbridges, sampling, tipping bays, silos or flat stores, crushing and refinery buildings, a jetty and a workshop. RFID earns its place at specific points. A tag on each truck read at the gate lane, the weighbridge and the exit gives a time at each stage; tags on tools and spares in the workshop show what is out and where; tags on returnable items such as sampling probes and sealing kit stop them going missing. The Eastport demo shows gate lanes and weighbridges on one map.
The truck queue and the appointment system

Trucks are the constraint everyone knows. The national appointment system for grain trucks covers Greater Rosario from Timbúes to Alvear, plus ports in Buenos Aires province, and shifts became mandatory on 18 September 2018. The government’s note then said that on a full harvest day about 1,000 of 10,000 trucks arrived without a shift and queues passed 20 km, and that the northern Rosario terminals handle 60 % of the country’s truck unloads.

The appointment is the state’s system; what happens between the gate and the tipping bay is yours. Read each truck’s tag at the gate lane and the weighbridge, post the row to a table, and the map colours the lane or the bay by how long the truck has been there; an alert rule such as “in the bay for more than 40 minutes” appears in the app with Show on map. The History player replays a peak day for the review. Spatial Map does not connect to the appointment system or to the grain traceability code; your own system supplies whatever you want on the map.

The public port: containers and agro-bulk

Puerto Rosario is run by the Ente Administrador Puerto Rosario, which is the public port authority, and its 2025 yearbook describes two terminals leased to private operators. The multipurpose terminal covers about 65 hectares with 1,600 m of berth front and a container yard for 7,000 TEU, and handled 85,175 TEU in 2025, or 821,852 tonnes of containerised cargo. The agro-bulk terminal covers about 20 hectares with storage for 225,000 tonnes of solid bulk, two Panamax berths and a yard for 350 trucks.

A terminal operating system runs the yard; Spatial Map is the map beside it. Draw the container blocks, reefer plugs, gate lanes and truck yard as areas, feed them from the terminal’s own table or a CSV export, and a warehouse or a shipping-line depot outside the gate can see its own boxes on the plan. RFID is most useful on the reusable things in a port: forklifts, trailers, lashing gear and the keys and tools of the workshop. See RFID tool tracking for the crib pattern.

A grain-trading city and the plants that run in shifts

Rosario’s trading institution is older than most of its plants: the Rosario Board of Trade traces itself to 18 August 1884, when the Centro Comercial de Rosario was founded, and it took its present name in 1898. The city is where grain is priced; the plants on the river are where it is stored, crushed and loaded, and they run in shifts around harvest peaks, with maintenance squeezed into short stops.

That makes spares and tools the quiet cost. A spare motor in the wrong store, a calibrated gauge that nobody can find, a lifting sling with no inspection date: each can hold a stop for hours. Tag them, draw each store and workshop as an area named like your readers, and the map shows where each item was last read. The Harborview demo shows equipment check-out and spares on three floors, and the Summit demo shows a plant with lines, workstations and 867 rack locations for materials.

Services for teams in Rosario

Where Rosario teams usually start:

  • Terminals and plants often begin with asset tracking for trucks, tools and spares, then a yard and gate map.
  • Warehouses outside the gate that serve exporters and importers start with inventory tracking at the dock doors.
  • RTLS and UWB matters for large yards and plants where vehicles and people must be located continuously; most sites will not need it first.
  • If you have no readers or tags yet, our team can source RFID readers, antennas and tags on request, quoted per project, with warranty and device support from the manufacturer: see hardware and demo kits on request.
  • Where a team has no developers, our team builds handheld RFID apps and integrations as client projects. The product runs as cloud or on-premises.

Also served nearby

The same approach covers San Lorenzo, Puerto General San Martín, Timbúes, Villa Gobernador Gálvez and Arroyo Seco on the river, and Santa Fe city to the north. Nothing needs to be installed at any of them: the map opens in a browser.

How Spatial Map does it

From the gate lane to the barge berth

  1. 01

    Pick one site

    A terminal, a crushing plant or a warehouse outside the gate, wherever a late truck or a missing spare costs most.

  2. 02

    Map lanes, bays and stores

    Upload the plan, photo or sketch, let AI Map draft the site, and name read points the way your middleware names them.

  3. 03

    Connect reads and tables

    RFID middleware, the weighbridge system and your ERP post rows through the table write API, a polled REST endpoint or CSV and Excel uploads.

  4. 04

    Add queue and silence rules

    In-app alerts for trucks waiting too long, tools overdue at the workshop and readers that stopped reporting.

What Rosario teams track

Trucks through gate lanes and weighbridges

Tag reads at each stage, with time in the lane and in the bay.

Spares, tools and calibrated gear

Check-out at the workshop, last-seen store and overdue items coloured on the plan.

Plants, lines and materials

Workstations, WIP carriers and racks coloured from your own system.

Warehouses beside the port

Stock by bin for exporters and importers, with staged pallets by lane.

See it on real demo facilities

Fictional names, real floor plans, live sensors, RFID, BLE tags and gateways — open any of them in the browser.

All 13 demo facilities

RFID tracking in Rosario: questions we get

No. It has no link to appointment, tax, customs or terminal systems. It shows what happens inside your own plant, from your own RFID reads, weighbridge or ERP rows and sensors, so it complements those systems rather than replacing them.

That depends on the tag, how it is mounted and where, so ask the vendor and test in your own lane before buying in volume. Windscreen labels, hard tags on trailers and metal-mount tags behave differently; the post on RFID tags for metal, liquids and apparel lists what to check. Spatial Map does not make hardware.

The weighbridge system alone is often enough to start: post each ticket as a row with its time and lane, and the map colours the lane. Tags add automatic reads at stages with no ticket, such as the entry gate and the bay.

It can show blocks, rows, reefer plugs, gate lanes and the truck yard as areas, coloured from a table your terminal system or a CSV export feeds. It does not run the yard: planning and equipment dispatch stay in the terminal operating system.

Yes. Your developers can push rows to a table through the write API (HTTPS, bearer API key, bulk upsert, 60 requests per minute per key), or expose a REST endpoint that Spatial Map polls. If you would rather not build it, our team does integrations as client projects.

No. Spatial Map is sold online and our team works with customers in Argentina remotely, by video call and through the contact form. There are no local resellers or partners.

In US dollars, the same worldwide: a 7-day free trial for up to 5 facilities with no card, then Pro at $60 a month or $600 a year for up to 4 facilities. RFID hardware, if you ask us to source it, is quoted per project and is not part of the subscription.

Map one Rosario gate lane before the next harvest peak.

Start the free trial and open the Eastport demo, or send us the plan of a terminal, plant or workshop and a sample of your weighbridge or RFID reads through the contact form.