Buenos Aires · Puerto Nuevo, Dock Sud, Pilar and Zárate

Warehouse tracking in Buenos Aires, from the port gate to the Pilar shed

Spatial Map does warehouse tracking in Buenos Aires on a live 3D map of each building: racks coloured from your WMS stock, dock doors and yard slots showing the trailer that is using them, RFID-tagged pallets shown at the reader that last saw them. The city’s freight has an unusual shape: the port is inside the city, the large sheds are outside it along the Panamericana and the river, and in between trucks wait for their turn. One workspace can hold every site, and the app is available in Spanish.

No credit card. Runs in the browser. Pro is $60/month for up to 4 facilities. Book a demo

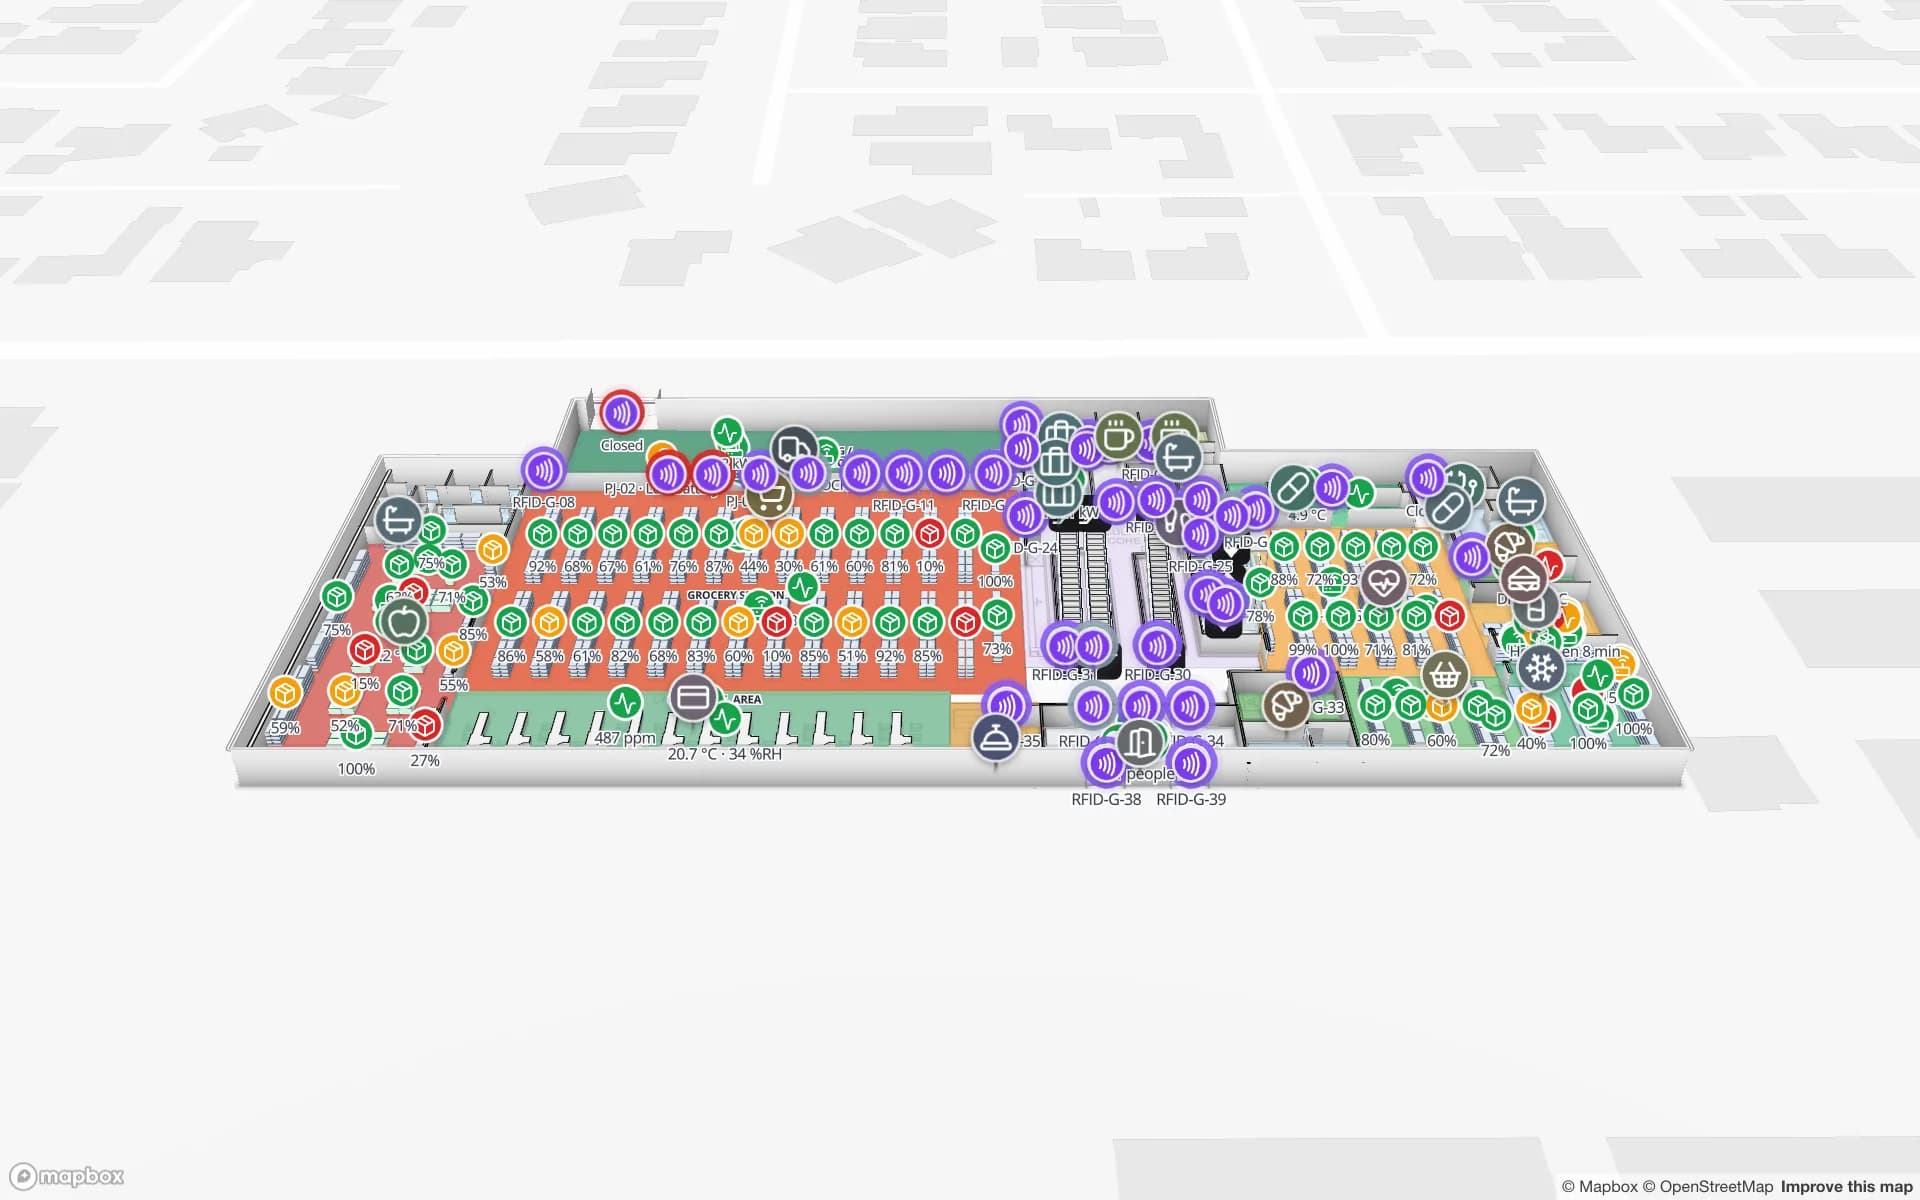
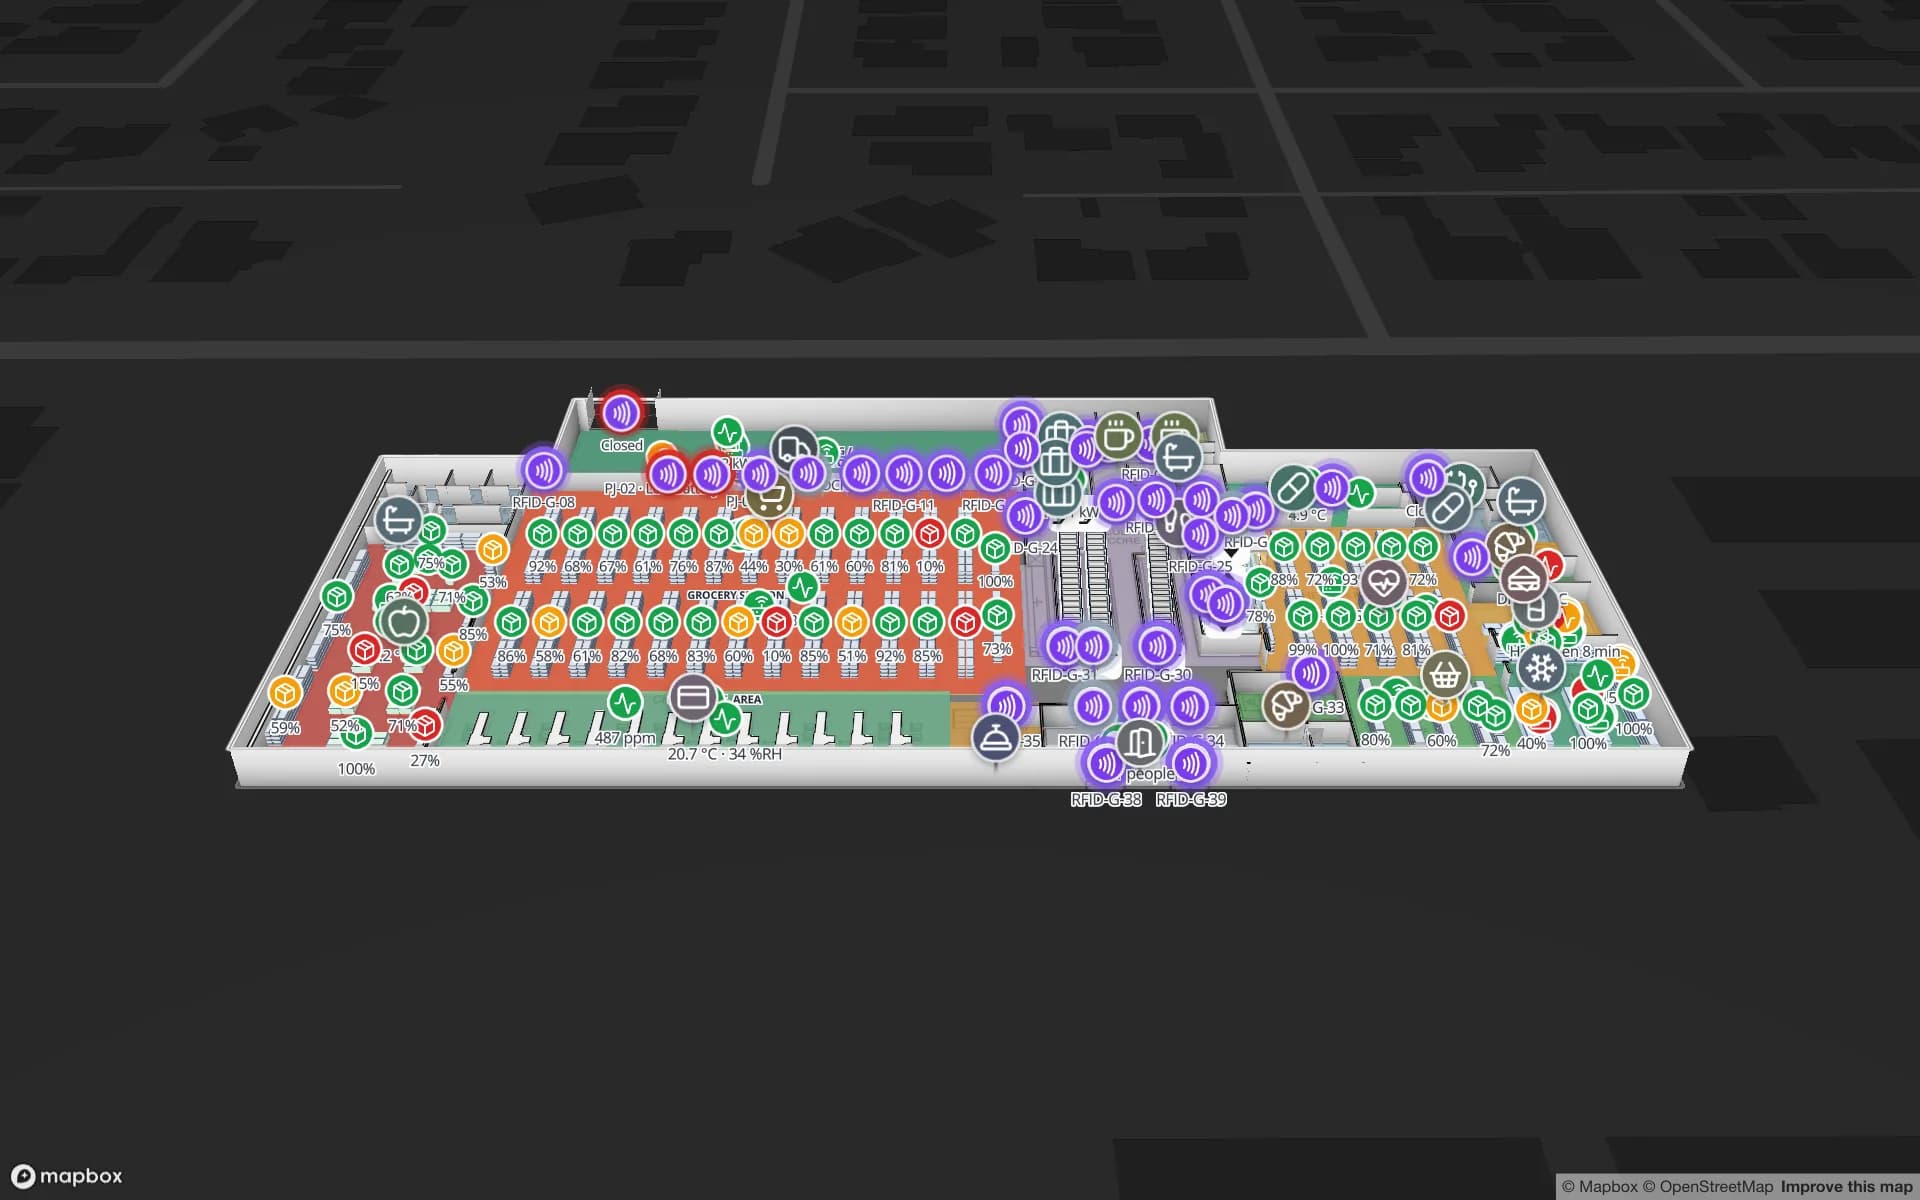
Crestline Fulfillment Center, a fulfillment center demo, in the Spatial Map 3D viewer with live device markers
Crestline Fulfillment Center
Crestline Fulfillment Center, a demo warehouse: 20 racks with 2,204 locations coloured by stock status, dock doors, staging lanes and the trailer yard.
Rack locations coloured by stock in the Crestline demo
2,204
Yard slots in the Eastport cross-dock demo
44
How often alert rules are checked, with alerts shown in the app
15 s
Free trial, up to 5 facilities, no card
7 days

A port at kilometre zero

The Port of Buenos Aires lies on the right bank of the River Plate at Km 0 and is part of the city itself. It is in two parts: Puerto Nuevo to the north and Dock Sud to the south, in the Avellaneda district, with container terminals at both. Its berths also take general and project cargo, railway cargo, grain and fertilizers in bulk, and fuel and gas.

Cargo does not stay at the quay. Import boxes are unpacked, and export boxes stuffed, in depots and bonded warehouses around Greater Buenos Aires, and the question inside each shed is the same: which pallet is in which lane, which container is at which door, which trailer is waiting in which yard slot. On a Spatial Map plan every dock door, staging lane and yard slot is an area coloured from your yard or WMS data. Spatial Map does not connect to terminal, customs or port-authority systems; it shows what your own reads and stock say.


The staging area and the single gate: where trucks wait

Heavy traffic is a daily constraint in the port. The port authority runs a staging area, the Zona de Apoyo Portuario, where trucks wait for their turn to enter the terminals, and in 2021 it reported works to build a single port access by extending Calle 14, with eight lanes for heavy traffic, connected to the Paseo del Bajo so trucks avoid city streets. The same works were to raise the 125 exclusive truck parking sites by 95 %, adding about 24,800 m².

The effect for a warehouse is that a truck’s arrival time is less predictable than its booking. A yard map turns that into something you can manage: the gate lane where a truck was read, the yard slot it was sent to, the dock door that is free next, and an in-app alert for a trailer that has been waiting longer than your rule. The Eastport Cross-Dock demo shows 50 dock doors, 44 yard slots and 1,180 RFID pallets, and the post on dock doors, trailers and yard visibility explains the setup.

Pilar: a park of 920 hectares

North-west of the city, the Parque Industrial Pilar was created in 1976, about 5 km from Pilar town. A 2021 trade-press profile gives it 920 hectares, of which 750 belong to installed companies, more than 200 companies and about 30,000 people a day. Parks of that size hold every kind of building: plants, third-party logistics sheds, returnable-packaging pools and spare-parts stores.

In a multi-client shed the stock belongs to several owners, and each wants to see its own bays. Map the building once, hold each client’s stock as rows in a table, and give each a read-only share link with the layers you choose, an expiry date and a view cap, with no account. The History player replays how a pallet moved when a count is disputed. The CSV bin inventory guide shows how a WMS export becomes a coloured rack map in an afternoon.

Zárate and the river towns

Up the Paraná from the capital, Zárate is described in the trade press as the country’s main gateway for cars. Its terminal has its own rail spur about a kilometre from the port and a short road link to Route 9, and it also takes containers, project cargo and agricultural machinery. Vehicle yards are a different problem from rack warehouses: thousands of units in rows, each waiting for a truck, a train or a ship.

Spatial Map draws each row and bay as an area and holds the vehicle list as a table, so a row of the plan can show how many units sit in it and which are on hold. Tags are only worth adding where a unit must be found without looking it up. The same page of the plan can carry a workshop, a wash bay and a pre-delivery inspection area.

Services for teams in Buenos Aires

Where Buenos Aires teams usually start:

  • Depots near the port and the airport often begin with inventory tracking at the dock doors, since a pallet missing at the door costs a delivery slot.
  • Third-party logistics operators add asset tracking for forklifts, roll cages and returnable pallets, so equipment is found before the next wave.
  • Cold stores get temperature monitoring next to the stock map; RTLS and UWB is for big yards and plants only.
  • If you have no readers or tags yet, our team can source RFID readers, antennas and tags on request, quoted per project, with warranty and device support from the manufacturer: see hardware and demo kits on request.
  • Where there is no in-house IT, our team builds an RFID inventory system, handheld apps and WMS or ERP integrations as client projects. The product runs as cloud or on-premises.

Also served nearby

The same approach covers Avellaneda and the rest of Dock Sud, Ezeiza and its airport, Escobar, Campana, Cañuelas and La Plata. Nothing needs to be installed at any of them: the map opens in a browser.

How Spatial Map does it

From the port gate to the dock door

  1. 01

    Pick one building

    A depot near the port, a shed in Pilar or a vehicle yard, wherever a missing pallet or a late trailer costs most.

  2. 02

    Map doors, lanes and racks

    Upload the plan or a photo, let AI Map draft the floor, and name locations the way your WMS names them.

  3. 03

    Load stock and gate reads

    The WMS or middleware posts rows through the table write API, or you start from a CSV or Excel export.

  4. 04

    Add wait and silence rules

    In-app alerts for trailers waiting too long, pallets staged past their slot and readers that stopped reporting.

What Buenos Aires teams track

Port-side depots and cross-docks

Dock doors, yard slots and RFID pallets between the gate and the racks.

Multi-client distribution sheds

Each client’s stock by bin, shared by read-only link.

Retail and e-commerce stock

Item-level stock by bin and by floor for stores and online orders.

Food and pharmaceutical cold rooms

Rooms tinted by live temperature, with reefer docks and in-app excursion alerts.

See it on real demo facilities

Fictional names, real floor plans, live sensors, RFID, BLE tags and gateways — open any of them in the browser.

All 13 demo facilities

Warehouse tracking in Buenos Aires: questions we get

No. It has no link to port, terminal or customs systems. It shows what happens inside your own building, from your own WMS, gate reads and RFID, so a container’s customs and terminal records stay where they are.

Only as far as your own data says so. If a driver app, a gate reader or a booking table posts a row when the truck leaves the staging area, the map can show it as arriving and colour the yard slot. Spatial Map does not read the port’s own queue.

Yes. Keep one facility, store each client’s stock as rows in a table, and give each a read-only share link with the layers you choose, an expiry date and a view cap. Inside the workspace, Owner, Admin, Editor and Viewer roles and custom roles control who can change what.

Yes. Export stock to CSV or Excel and upload it to a table; racks colour by status the same day. Later, your developers or ours can push rows through the write API (HTTPS, bearer key, bulk upsert, 60 requests per minute per key).

It can show a yard as rows and bays and the vehicle list as a table, with counts per row and a status colour. Locating one unit in real time needs tags or a positioning system on it; Spatial Map shows what your tags or system report and never computes positions from signal strength itself.

Yes, in Spanish and five other languages, with each user choosing their own; Rack codes, room names and report titles appear exactly as you type them. See the services page in Spanish.

No. Spatial Map is sold online and our team works with customers in Argentina remotely, by video call and through the contact form. There are no local resellers or partners.

In US dollars, the same worldwide: a 7-day free trial for up to 5 facilities with no card, then Pro at $60 a month or $600 a year for up to 4 facilities. RFID hardware, if you ask us to source it, is quoted per project and is not part of the subscription.

Map one Buenos Aires warehouse before the next peak.

Start the free trial and open the Crestline demo, or send us the plan of a port-side depot, Pilar shed or vehicle yard and a stock export through the contact form.