Luanda · The port, Viana and the Bom Jesus airport

Warehouse tracking in Luanda, from the port gate to the Viana racks

Spatial Map shows a warehouse as a live 3D map: racks and lanes coloured from your stock list, dock doors and yard slots coloured by what stands in them, and RFID pallets placed at the reader that last saw them. Warehouse tracking in Luanda follows the route that goods take: through the port, by road or rail inland to Viana, and into sheds and distribution centres across the city’s industrial reserves. Each shed, yard and plant is its own facility, and all of them can share one workspace.

No credit card. Runs in the browser. Pro is $60/month for up to 4 facilities. Book a demo

Crestline Fulfillment Center, a fulfillment center demo, in the Spatial Map 3D viewer with live device markers
Crestline Fulfillment Center
Crestline Fulfillment, a demo distribution centre: 20 racks with 2,204 locations, pick modules, staging lanes, dock doors and the trailer yard.
Rack locations in the Crestline fulfillment demo
2,204
Dock doors in the Eastport cross-dock demo
50
How often alert rules are checked, with alerts shown in the app
15 s
Free trial, up to 5 facilities, no card
7 days

The port, and what leaves its gate

The Port of Luanda works through several terminals, and a 2026 industry guide describes the port as being expanded, with a new container terminal under construction. A container that leaves the gate is stripped at a freight station, a bonded shed or an importer’s own warehouse, and the goods inside it are split by consignee, order or shop.

That split is where stock gets lost. Tag each pallet or carton at receiving, read it at the stripping bay and again at the door it leaves by, and the map shows what came out of which box and where it went. The Eastport demo shows the same flow with 50 dock doors and 1,180 RFID pallets, and the post on yard visibility, dock doors and trailers walks through the layout. Spatial Map does not connect to customs, JUCE or the terminal systems.


Viana: a 4,717-hectare reserve and a dry port

The Viana industrial reserve is the larger of the two reserves of the Luanda–Bengo Special Economic Zone, at 4,717.91 hectares, according to Presidential Decree 81/21 of March 2021. Viana is also where a dry port stands inland from the port, and press reports describe a railway between the Port of Luanda and the Viana dry port carrying containers. Between a quay, a railhead and a warehouse, the same box can be in three systems in one day.

In a Viana warehouse the map shows rack locations by stock status, staging lanes by order and trailers in their yard slots. Import your WMS or spreadsheet stock list as a CSV or Excel file, colour the racks by status and add RFID at the doors that matter most. The post on CSV bin inventory to a live rack map shows how a plain list becomes a map in an afternoon.

Bom Jesus: the new airport and its cargo

The new Luanda international airport at Bom Jesus, in the municipality of Icolo e Bengo, was inaugurated on 10 November 2023 and opened in phases, with cargo services first. Airport cargo is stock with a very short clock: parcels and pallets arrive, wait for clearance and leave within hours or days.

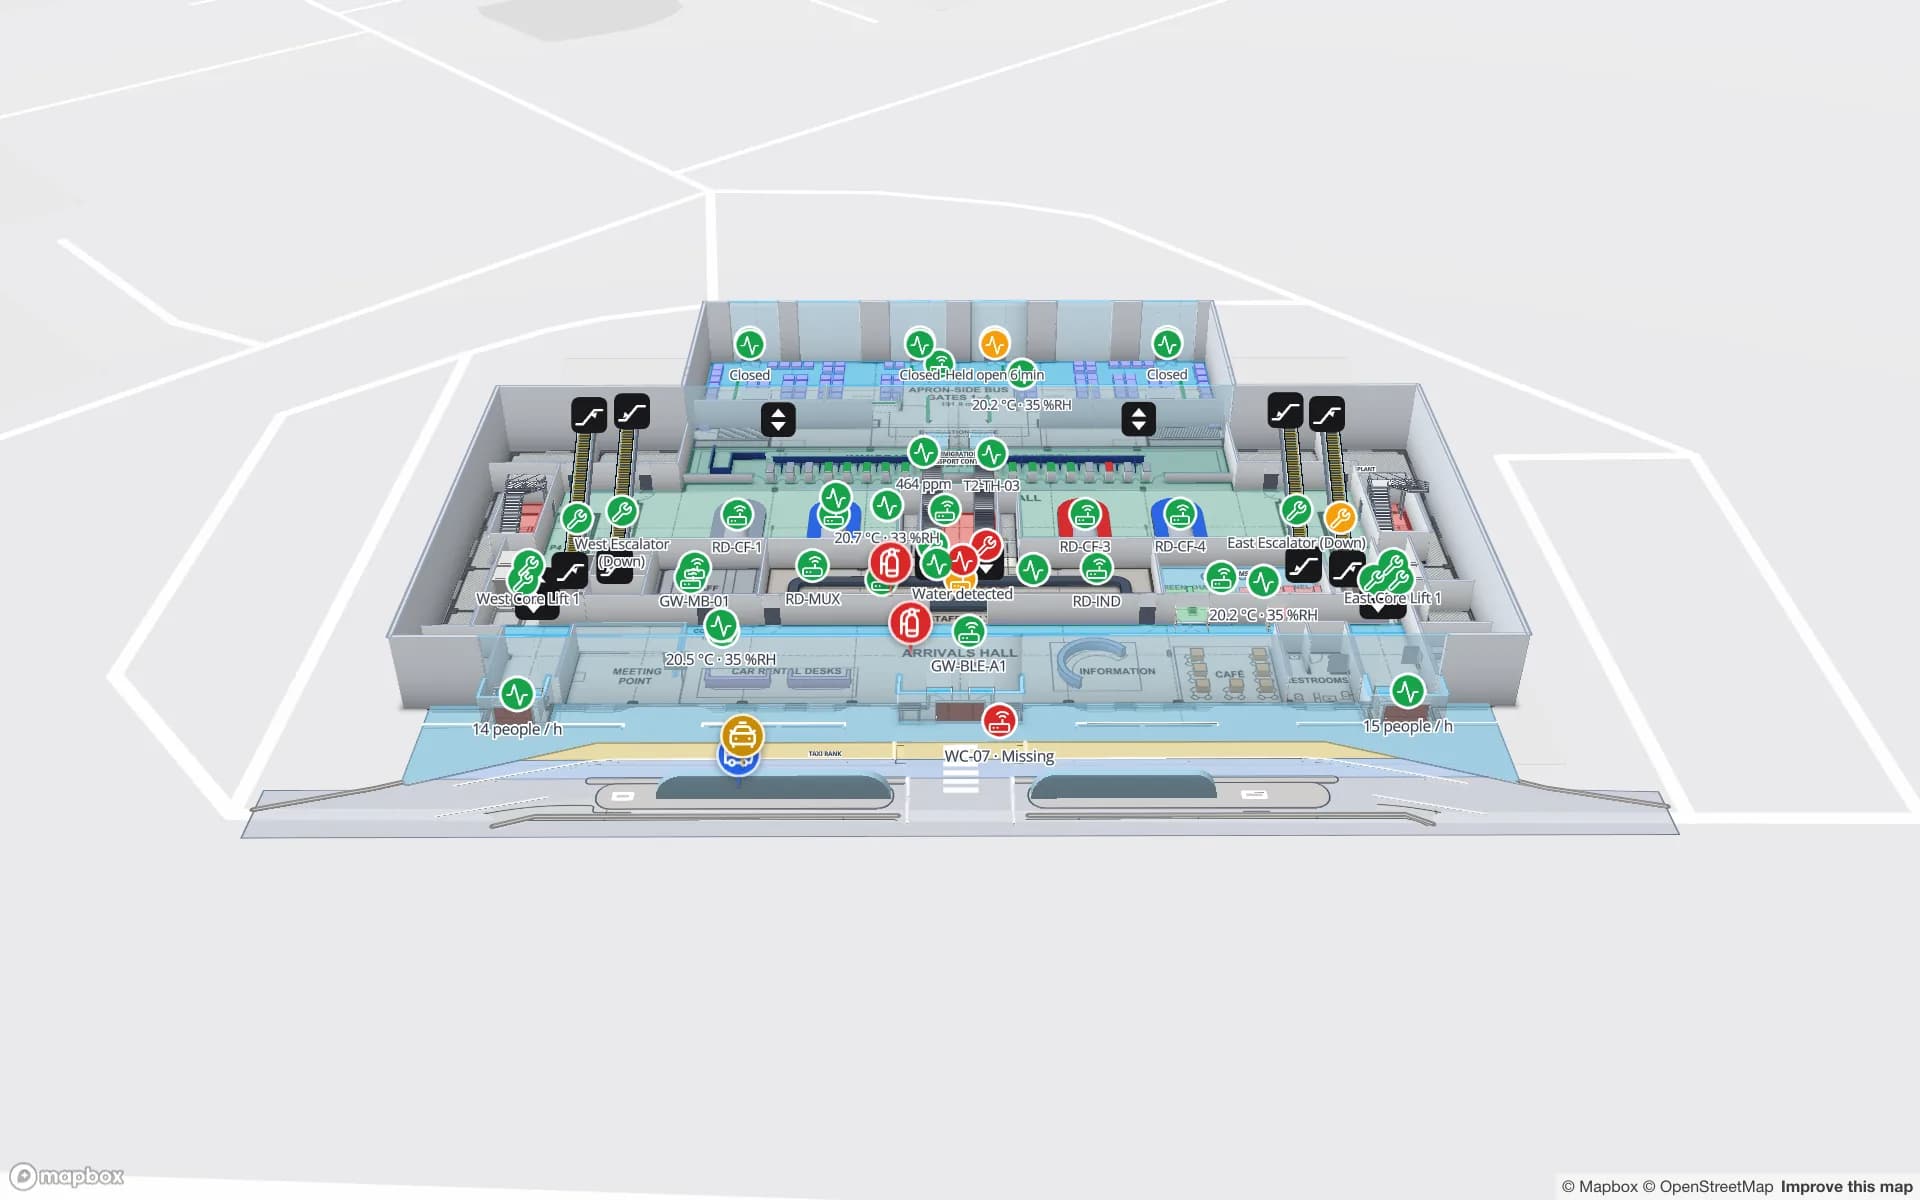
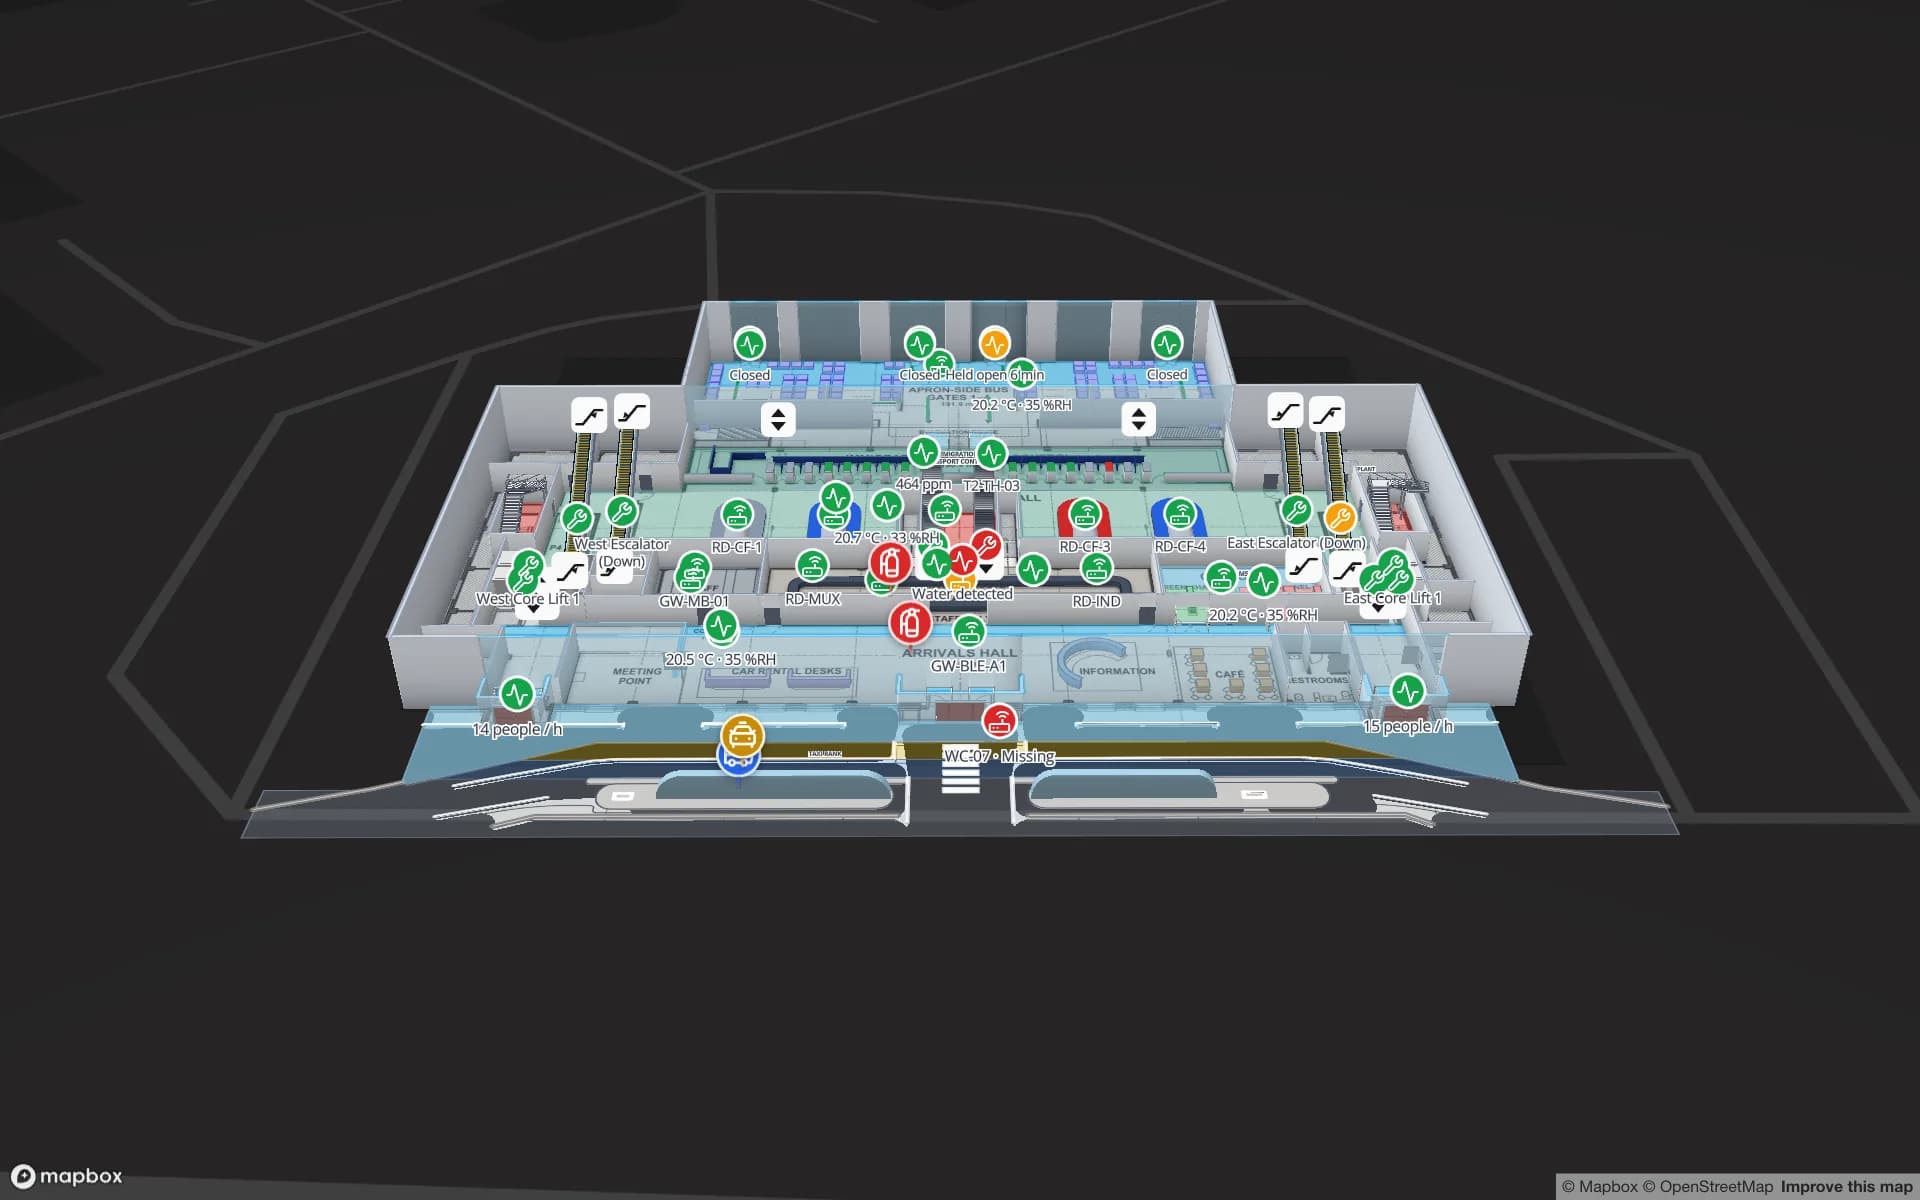
A cargo shed is easiest to read as areas — arrivals, held, cleared, collection — with a tag or scan putting each consignment in one of them and an in-app alert flagging any that sits in “held” for too long. The airport demo shows a large airport operation on the same kind of map, and indoor maps for airports describes the building side.

Cacimbo, humidity and the grid

Luanda’s dry season, the cacimbo, runs roughly from May to September, with almost no rain from June to August and mean temperatures near 22 °C in July and August against about 28 °C in March; humidity rises again from October to April. Cartons, labels and electronics respond differently to dry mist and to humid heat, and a store in a metal shed is neither the one nor the other.

Put a temperature and humidity sensor in each store, and the map colours the store by its latest reading, with an in-app alert when a reading stays out of range or a sensor goes quiet. Power matters too: in January 2025 a grid interruption left 11 Angolan provinces without electricity for some hours before supply was restored the next day. A “not updated for N minutes” rule on the reader table shows when a portal has stopped reporting, and the History player shows the gap. See warehouse temperature mapping.

Services for teams in Luanda

Where Luanda teams usually start depends on the building:

  • Importers, bonded sheds and distributors usually begin with inventory tracking by lane and consignee at the dock doors.
  • Plants and yards in Viana add asset tracking for forklifts, trailers, containers and returnable pallets.
  • RTLS and UWB matters mainly for large yards and plants where vehicles and people must be located continuously; most warehouses will not need it first.
  • If you have no readers or tags yet, our team can source RFID readers, antennas and tags on request, quoted per project, with warranty and device support from the manufacturer: see hardware and demo kits on request.
  • Where in-house IT is thin, our team builds Android RFID handheld apps, WMS integrations and other custom software such as POS or booking systems as client projects. Run the product as cloud or on-premises. The interface has no Portuguese version; names you type appear as typed.

Also served nearby

The same page covers Viana, Cacuaco, Zango, Catete, Icolo e Bengo and Bom Jesus. Lobito, Benguela and the rest of the country are covered with the Angola overview.

How Spatial Map does it

From the port gate to the rack

  1. 01

    Pick one building

    A bonded shed, a Viana warehouse or an airport cargo shed — wherever a missing pallet costs a delivery.

  2. 02

    Map lanes, slots and racks

    Upload the plan, let AI Map draft the floor for review, and number yard slots the way your yard system does.

  3. 03

    Connect reads and stock

    RFID middleware, scanners and your WMS post rows through the table write API, a polled REST endpoint or CSV and Excel uploads.

  4. 04

    Add lane and silence rules

    In-app alerts for pallets waiting too long, consignments held past their time and readers that stopped reporting.

What Luanda teams track

Bonded sheds and freight stations

Lanes per consignee, pallets waiting for trucks, days in the shed.

Distribution centres

Stock by bin, staging lanes and trailer yard before the next run.

Plant stores in Viana

Raw-material and finished-goods racks, with lots staged for despatch.

Airport cargo sheds

Consignments by stage, from arrival to collection.

See it on real demo facilities

Fictional names, real floor plans, live sensors, RFID, BLE tags and gateways — open any of them in the browser.

All 13 demo facilities

Warehouse tracking in Luanda — questions we get

No. It shows what happens inside your own shed or yard, from your own stock list, RFID reads, scanners and sensors, so it complements port, customs and single-window systems rather than replacing them.

Draw one lane or area per consignee, tag the pallets at receiving, and let your WMS post the owner as a field. The map colours stock by owner, and a read-only share link can be locked to one customer’s floor and layers, with an expiry date.

No. The app is available in English, French, Spanish, German, Arabic and Chinese. Your own room names, rack codes and report titles can be written in Portuguese and appear exactly as typed.

Yes. Upload a PDF, a DWG from AutoCAD R2004–R2018 or a photo, align it at real size and let AI Map draft the walls, doors and racks for a person to review. Our services team can also do the mapping remotely.

A “not updated for N minutes” rule on the reader table raises an in-app alert, and the History player shows the gap. Your RFID middleware should buffer on site and post the reads when the connection returns.

No. Spatial Map is sold online and our team works with customers in Angola remotely, by video call and through the contact form. There are no local resellers or partners.

In US dollars, the same worldwide: a 7-day free trial for up to 5 facilities with no card, then Pro at $60 a month or $600 a year for up to 4 facilities. RFID hardware, if you ask us to source it, is quoted per project and is not part of the subscription.

Map one Luanda warehouse before the next container.

Start the free trial and open the Crestline demo, or send us the plan of a shed or distribution centre and a sample of your stock list through the contact form.