Cape Town · Fruit and wine exports, the port and the cold stores

Cold chain monitoring in Cape Town, from packhouse to reefer stack

Spatial Map does cold chain monitoring in Cape Town on a live 3D map of the cold store itself: every cold room takes the colour of its latest reading, pallets show in the room and bay that holds them, and an in-app alert fires when a room stays out of range. Cape Town is where the Western Cape’s fruit and wine meet the sea, and the weeks before a vessel sails are when a warm room or a missing pallet costs most. The map shows what your own sensors and records say, in the building where it is happening.

No credit card. Runs in the browser. Pro is $60/month for up to 4 facilities. Book a demo

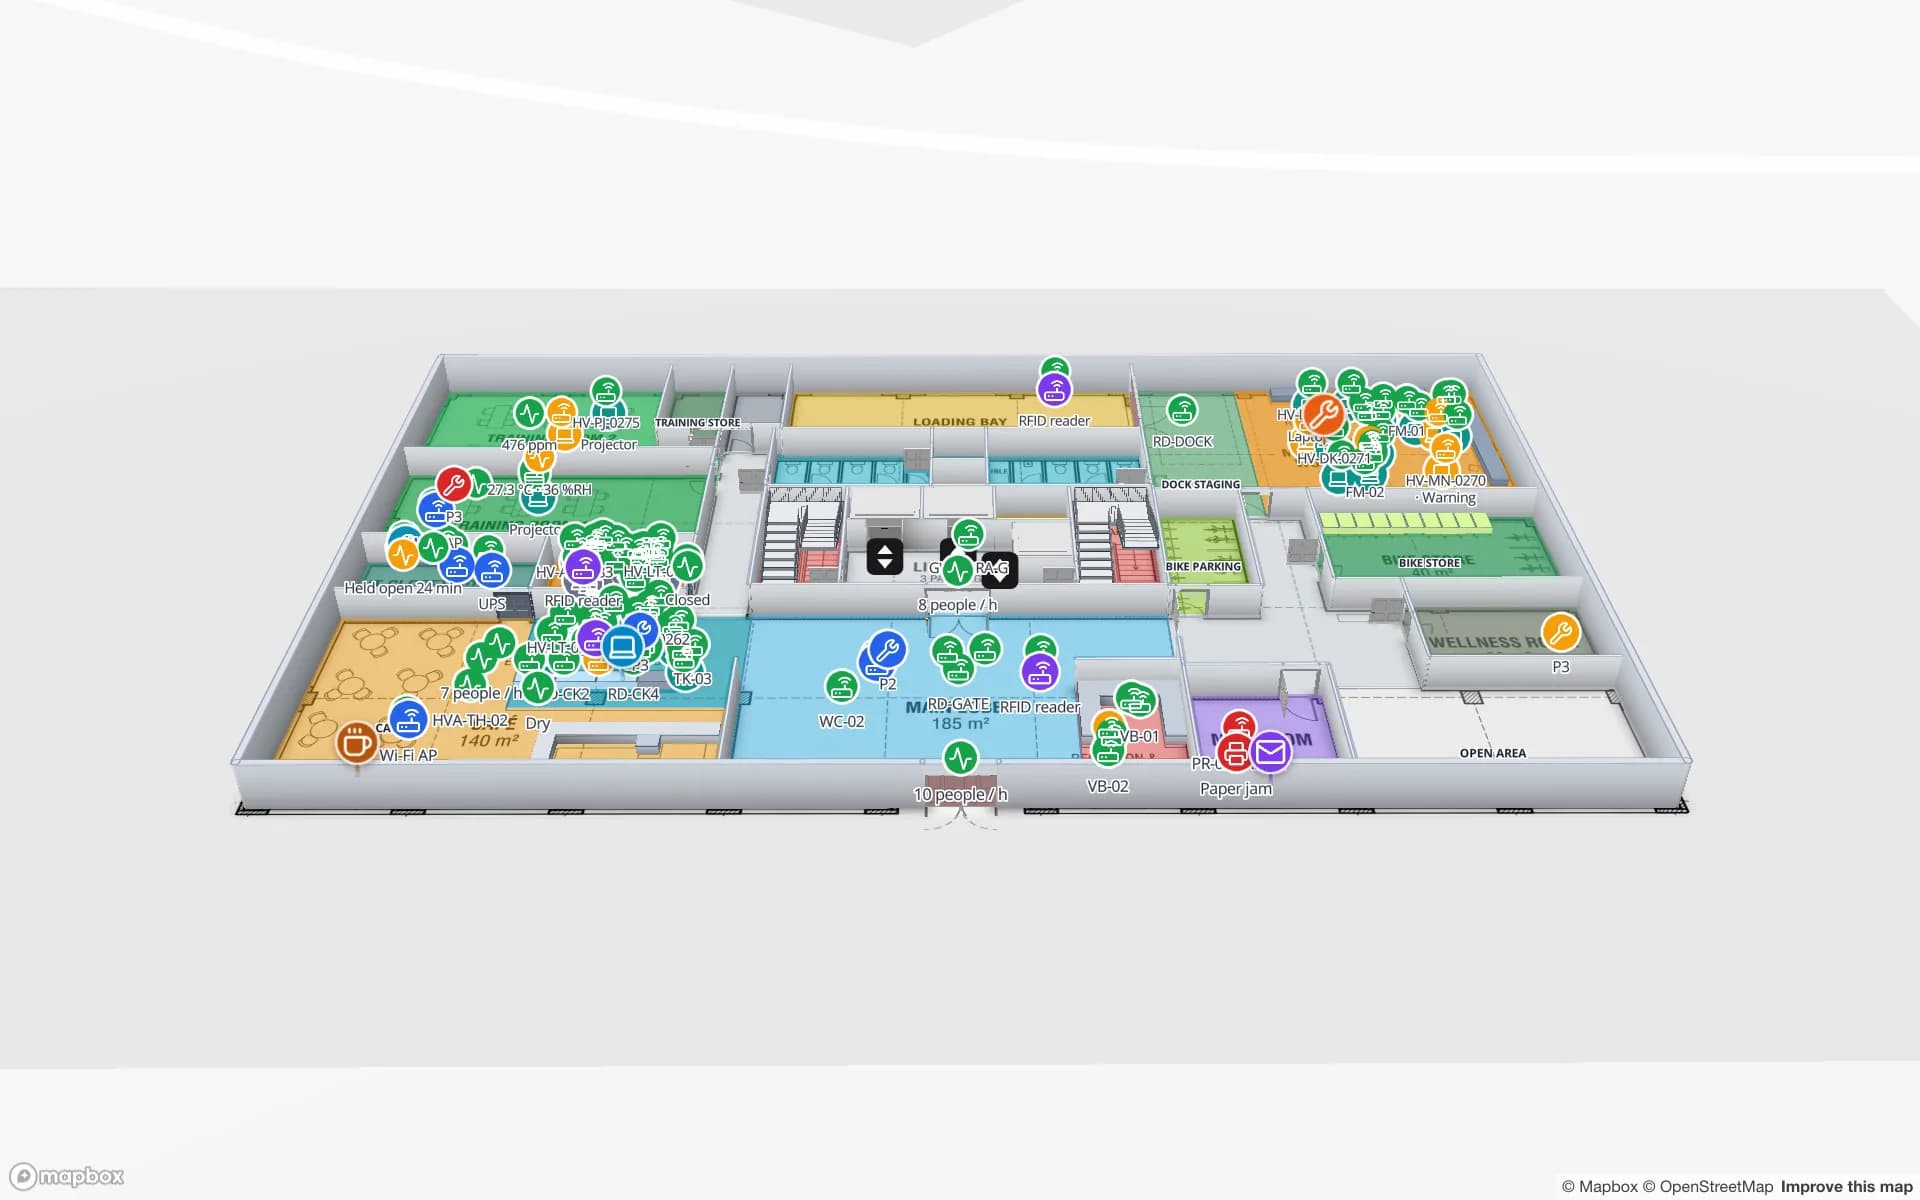
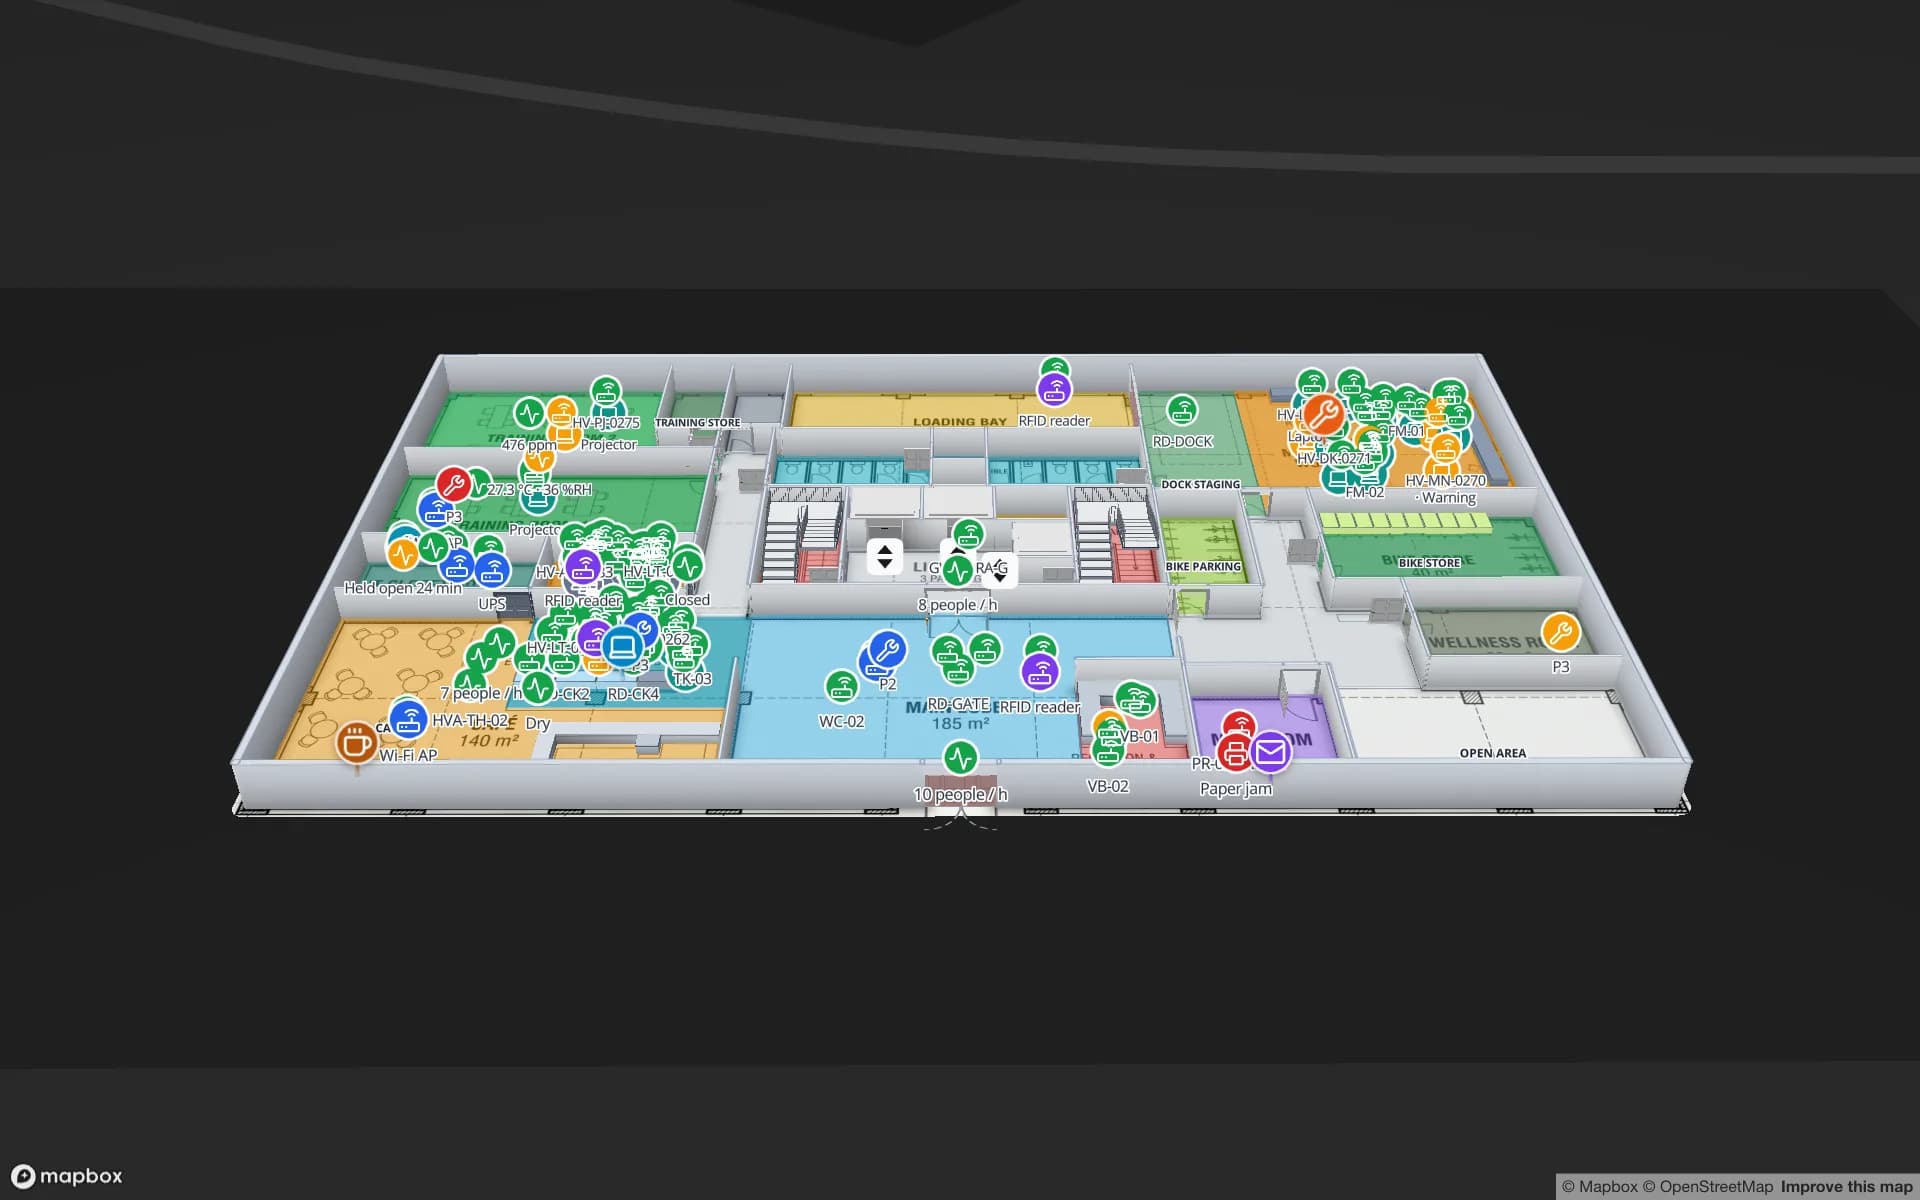
Polar Pharma — Cold Storage & QC Facility, a pharmaceutical cold store & qc lab demo, in the Spatial Map 3D viewer with live device markers
Polar Pharma — Cold Storage & QC Facility
Polar Pharma, a demo cold store: temperature zones tinted from their probes, cold-room doors, reefer docks and 1,140 rack locations.
Rack locations in the Polar Pharma cold-store demo
1,140
How often alert rules are checked, with alerts shown in the app
15 s
Write API limit per key for batched sensor readings
60 req/min
Free trial, up to 5 facilities, no credit card
7 days

The wind, the plugs and the reefer stack

Most of what Cape Town ships by sea in the fruit season goes in reefer containers, and the port’s weather is part of the cold chain. The CSIR reports that extreme wind has cost the port about 1,200 hours of operating time a year on average in recent years, which is why a pallet that is ready on Monday may still be waiting in a cold room on Friday. For the 2025/26 season the Western Cape Government, the port’s terminal operator and fruit-industry bodies renewed a partnership that adds two 500 kVA generators, each with 60 reefer plug points, to create an extra reefer stack at the Cape Town Container Terminal in the peak weeks from Week 52 to Week 11. One stated aim is to keep the terminal ready for disruptions such as several windbound days.

Those plugs are the terminal’s, not yours, and Spatial Map does not connect to port systems. What it does is show the part you control: the pre-cooling room, the cold store and the staging bay in front of the dock, with each pallet’s room and the temperature of that room. When the port stops for wind, the question that matters on your side is how many pallets are now waiting, in which rooms, and how long they have been out of the reefer. That is a question for a map, not a spreadsheet.


A short season and not enough cold rooms

Hortgro, the deciduous fruit industry body, has said cold storage for stone fruit and table grapes is limited, and in big-crop seasons the apple and pear stores fill as well. When space is that tight, a store manager does not just need to know the temperature; they need to know which rooms have free bays, which pallets are the oldest, and which lot has to ship first.

On the map each room is an area coloured by its latest reading, each rack or bay by its fill, and each pallet by its status; a style rule can colour lots by days in store. Row history and the History player let you replay a night, so you can see when a door stayed open or a probe drifted. The Polar Pharma demo shows the pattern in a pharmaceutical store with temperature zones tinted from their probes, cold-room doors and reefer docks.

Wine is a temperature story too

The Western Cape government put the Port of Cape Town at 52 % of the province’s exports in 2021, and Wesgro’s 2022 Cape Winelands factsheet ranks wine and grapes second and third among that district’s export earnings. Wine does not need a freezer, but it does need steady temperatures: cellars, bottling halls and finished-goods warehouses around Stellenbosch and Paarl hold stock that is damaged by a hot week more than by a missing pallet.

For a producer or a bottling and logistics business, put loggers or BLE temperature tags in each hall, let your gateway post readings to a table, and Spatial Map colours the halls and shows the hottest corner on a heatmap, which stops at walls and closed doors. Pair it with stock by rack from your own system and you have one view of where the stock is and how warm it has been.

Perishables by air from Cape Town International

Wesgro’s air cargo brochure lists premium perishables among the Western Cape’s air cargo, and Creamer Media reported record air cargo through Cape Town International Airport in 2024. Air freight is the fast lane for berries, flowers, fish and high-value produce, and its cool rooms are small and busy: a few hours between receiving, build-up and the flight.

A cool-room map with doors, bays and a timer is enough to answer the questions an airfreight team asks: which consignments are in the room, how long they have been there and what the temperature was. An alert rule on “out of range for N minutes”, checked every 15 seconds, appears in the bell, as a toast and on the Alerts page with Show on map. There is no email, SMS or push, and Spatial Map does not issue cold-chain certificates; your quality system and export documents stay the record.

What you need to monitor a Cape Town cold store

Spatial Map does not make sensors. You need temperature probes or loggers in each room and a gateway or logger platform that can send readings; anything that can call an HTTPS API can post them to a table (bearer key, bulk upsert, 60 requests a minute per key), and CSV and JSON uploads work for loggers that only export files. BLE temperature tags work through a gateway that your integrator or our team connects, and our team can source devices on request, quoted per project, with warranty and support from the manufacturer.

Spatial Map never calculates a position or a temperature itself. If a room needs calibrated, certified instruments, that is a decision for your quality team and the instrument supplier. The warehouse sensor alert rules and cold storage temperature monitoring heatmap posts explain how rules and heatmaps are set up.

Services for teams in Cape Town

Where cold-store and export teams in the Western Cape usually begin:

  • Packhouses, cold stores and exporters start with temperature monitoring and the cold-chain solution, then add pallet tags once the rooms are on the map.
  • Freight forwarders and port-side depots usually pair that with inventory tracking at the dock doors, because a pallet that sat in a staging bay while the port was windbound is the one that fails first.
  • Equipment that moves between rooms, such as pallet trucks, loggers and returnable crates, is the job of asset tracking; RTLS and UWB is only needed for big yards where vehicles must be located continuously.
  • If you have no sensors or tags yet, hardware and demo kits on request explains what our team can source and quote; for a handheld counting app or ERP link we build custom software as client projects, and the product runs as cloud or on-premises.

Also served nearby

The same approach covers cold stores and packhouses in Epping, Montague Gardens and Atlantis, the fruit districts of Elgin and Ceres, and the Winelands towns of Stellenbosch, Paarl and Worcester. The map opens in a browser, so nothing is installed at any of them.

How Spatial Map does it

From the cold room plan to a live temperature map

  1. 01

    Map each room

    Upload the plan or a photo of it; AI Map drafts the walls, doors and racks for review, and you name each cold room as your logger platform does.

  2. 02

    Connect the readings

    Loggers, BLE tag gateways or your middleware post temperature rows to a table, or Spatial Map polls a REST endpoint; CSV works for a first test.

  3. 03

    Colour rooms and pallets

    Data links tint each room by its latest value and show pallets at their bay with lot, variety or destination in the drawer.

  4. 04

    Set the rules

    In-app alerts for a room out of range for N minutes, a probe not updated for N minutes, or a pallet in staging too long.

What Cape Town teams monitor

Fruit cold stores and pre-cooling rooms

Rooms by live temperature, pallets by bay and lot, and a replay of any night.

Port-side depots and cross-docks

Dock doors, yard slots and pallets staged while a vessel waits.

Wine and beverage warehouses

Hall temperatures on a heatmap, stock by rack from your own system.

Airfreight cool rooms

Consignments by room with time in the room and the latest temperature.

See it on real demo facilities

Fictional names, real floor plans, live sensors, RFID, BLE tags and gateways — open any of them in the browser.

All 13 demo facilities

Cold chain monitoring in Cape Town — questions we get

No. It has no link to the port or its terminal systems. It shows your own cold rooms, bays and pallets from your own sensors and records, so you can see how many pallets are waiting on your side when the port stops for wind.

Use the map to see what is waiting. Pallets by room with time in the room, rooms with free bays and the oldest lots show which loads to ship first once the terminal restarts, and an in-app alert tells the shift team when a room has been out of range for the minutes you set. The decision to divert or hold stays with your logistics team.

Yes, if each supplier’s platform can send rows through the write API, a REST endpoint Spatial Map polls, or a CSV or JSON upload. Readings from both go to the same table or to two tables that one data link layer shows together; the map does not care who made the probe.

The map itself runs in the cloud, so you need a connection to view it. Your gateway or middleware can buffer readings during an outage and post them in batches when the link returns, and a “not updated for N minutes” alert rule shows which probe or gateway went quiet. See the South Africa page for more on this.

No. Spatial Map is sold online and our team works with South African customers remotely, by video call and through the contact form. There are no local resellers or partners.

No. Pricing is the same worldwide in US dollars: a 7-day free trial for up to 5 facilities with no credit card, then Pro at $60 a month or $600 a year for up to 4 facilities. Sensors, if you ask us to source them, are quoted per project and are not part of the subscription.

Put one cold room on the map before the season peaks.

Start the free trial and open the Polar Pharma demo, or send us a plan of a cold store and a sample of your logger readings through the contact form.