Africa · South Africa

Indoor mapping in South Africa, with RFID and sensor tracking

Spatial Map is browser-based indoor mapping software that turns a floor plan into a live 3D map of your stock, readers and sensors. Indoor mapping in South Africa usually starts with one of four building types: a warehouse near Durban, the country’s busiest container port; a distribution centre in Gauteng serving a national retail chain; a supply store behind a mine; or a packhouse and cold store holding fruit for export. Spatial Map puts each of them on a map that head office and the site see the same way.

No credit card. Runs in the browser. Pro is $60/month for up to 4 facilities. Book a demo

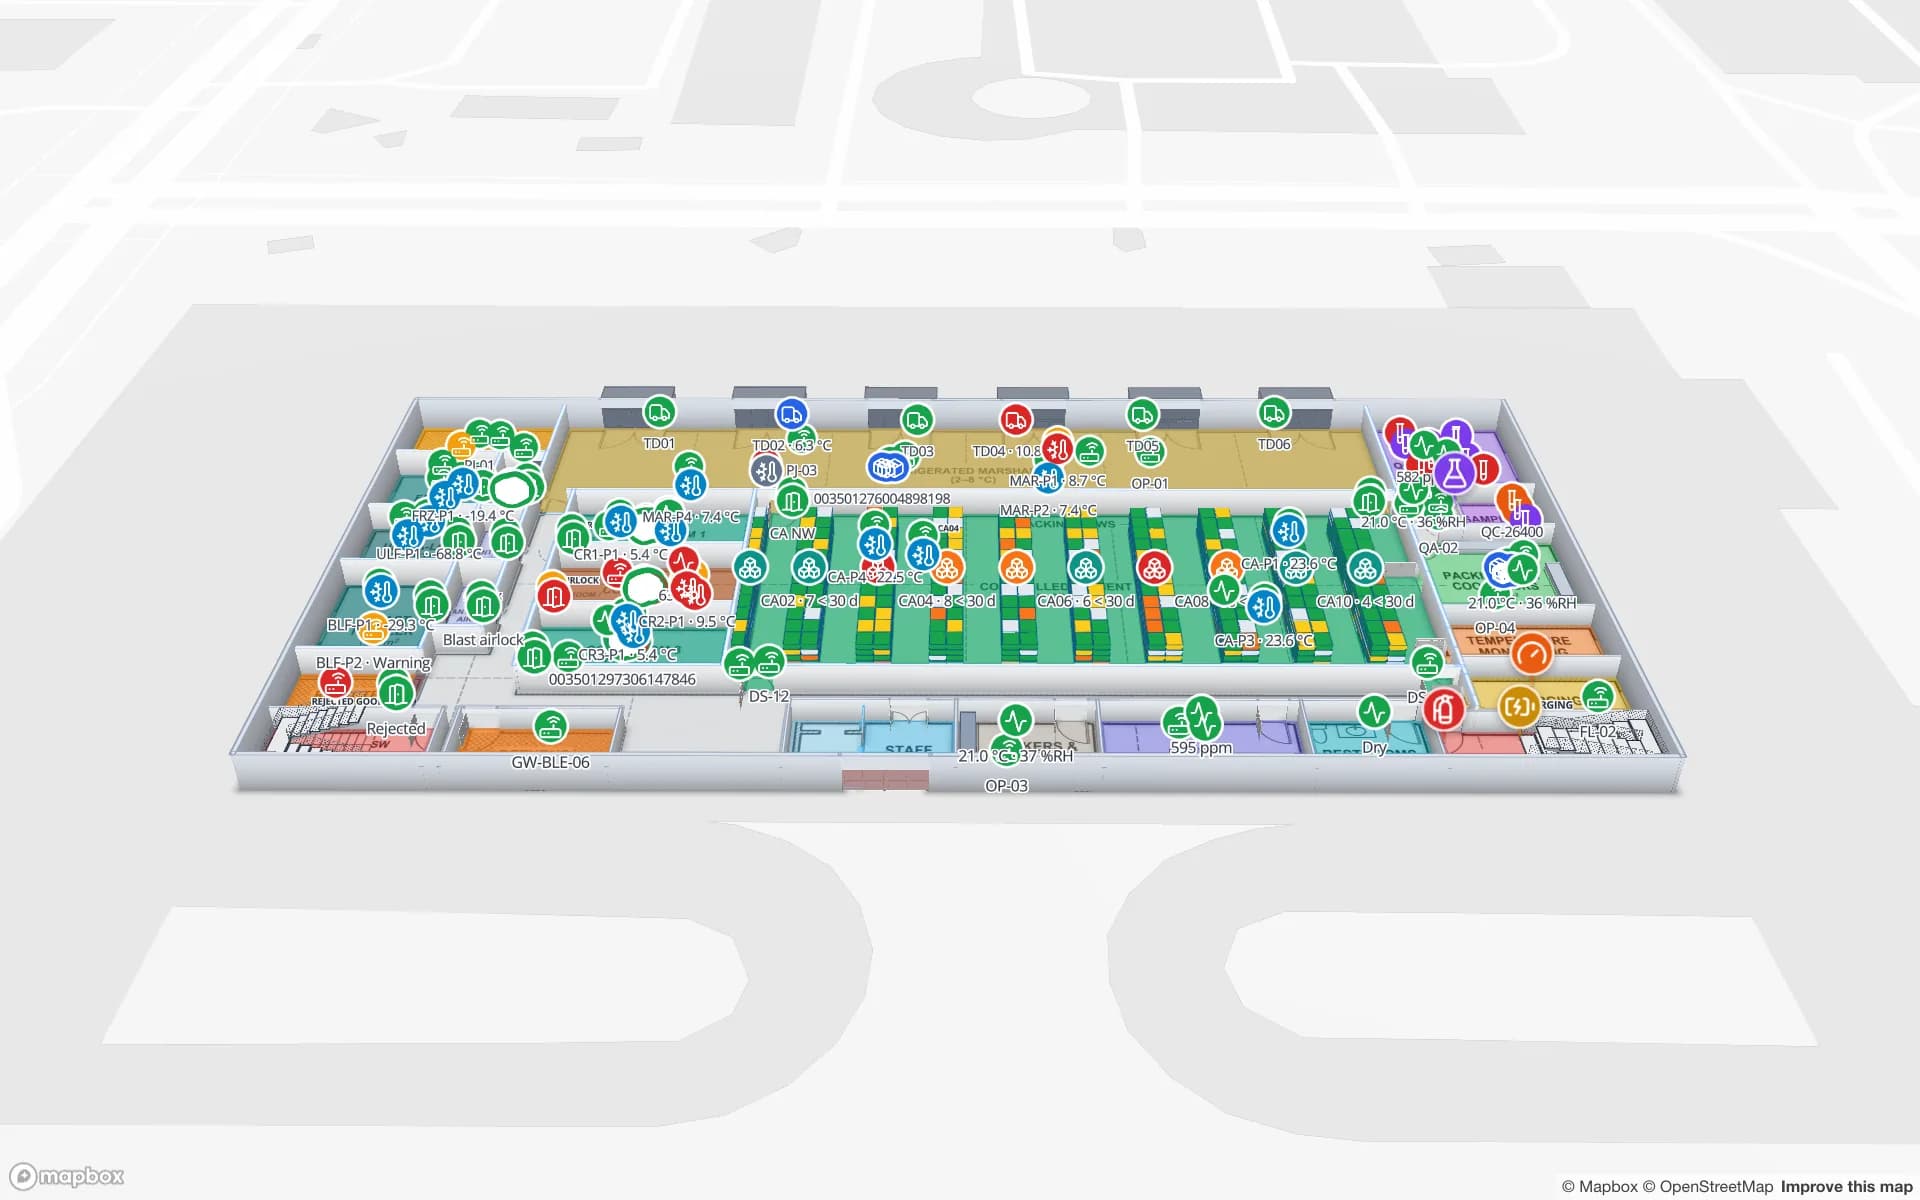
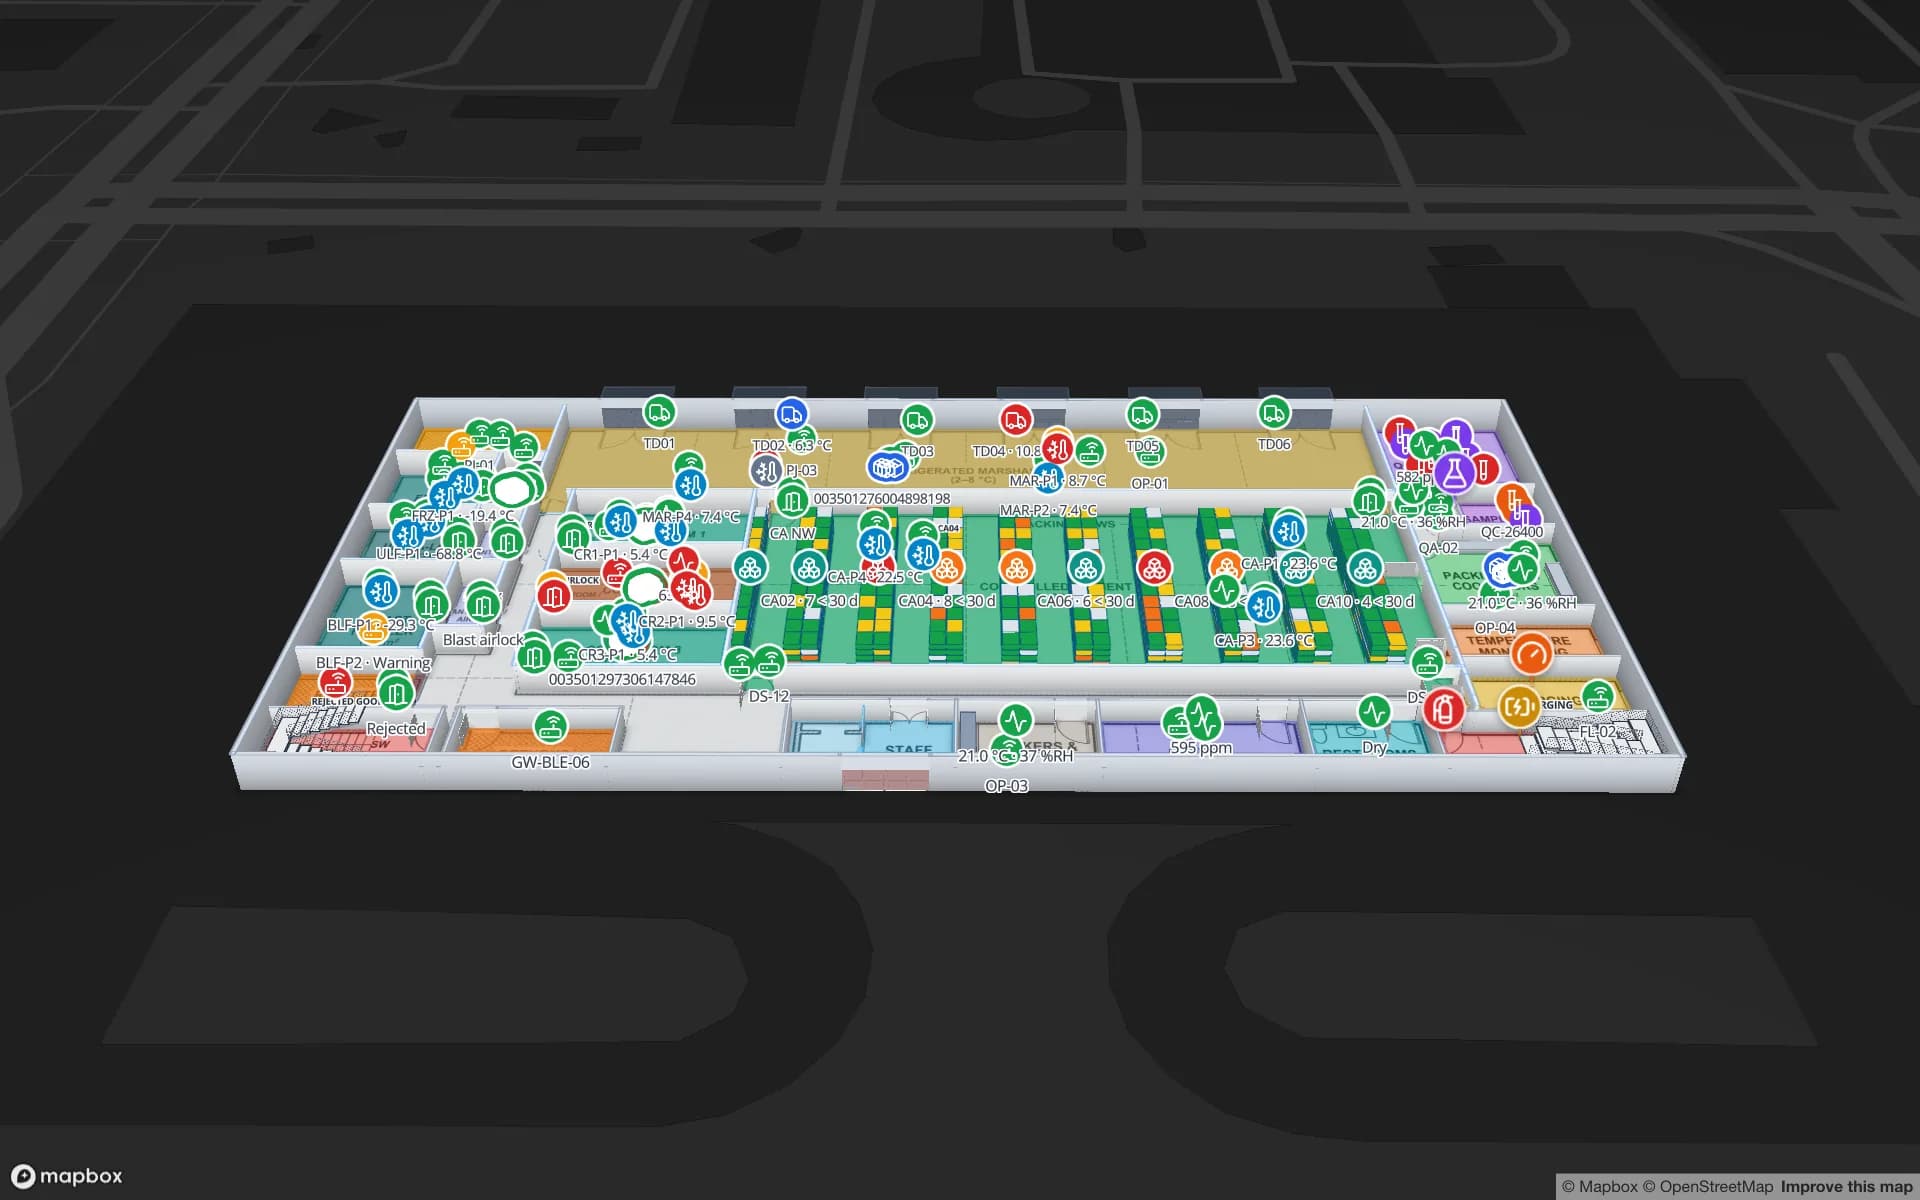
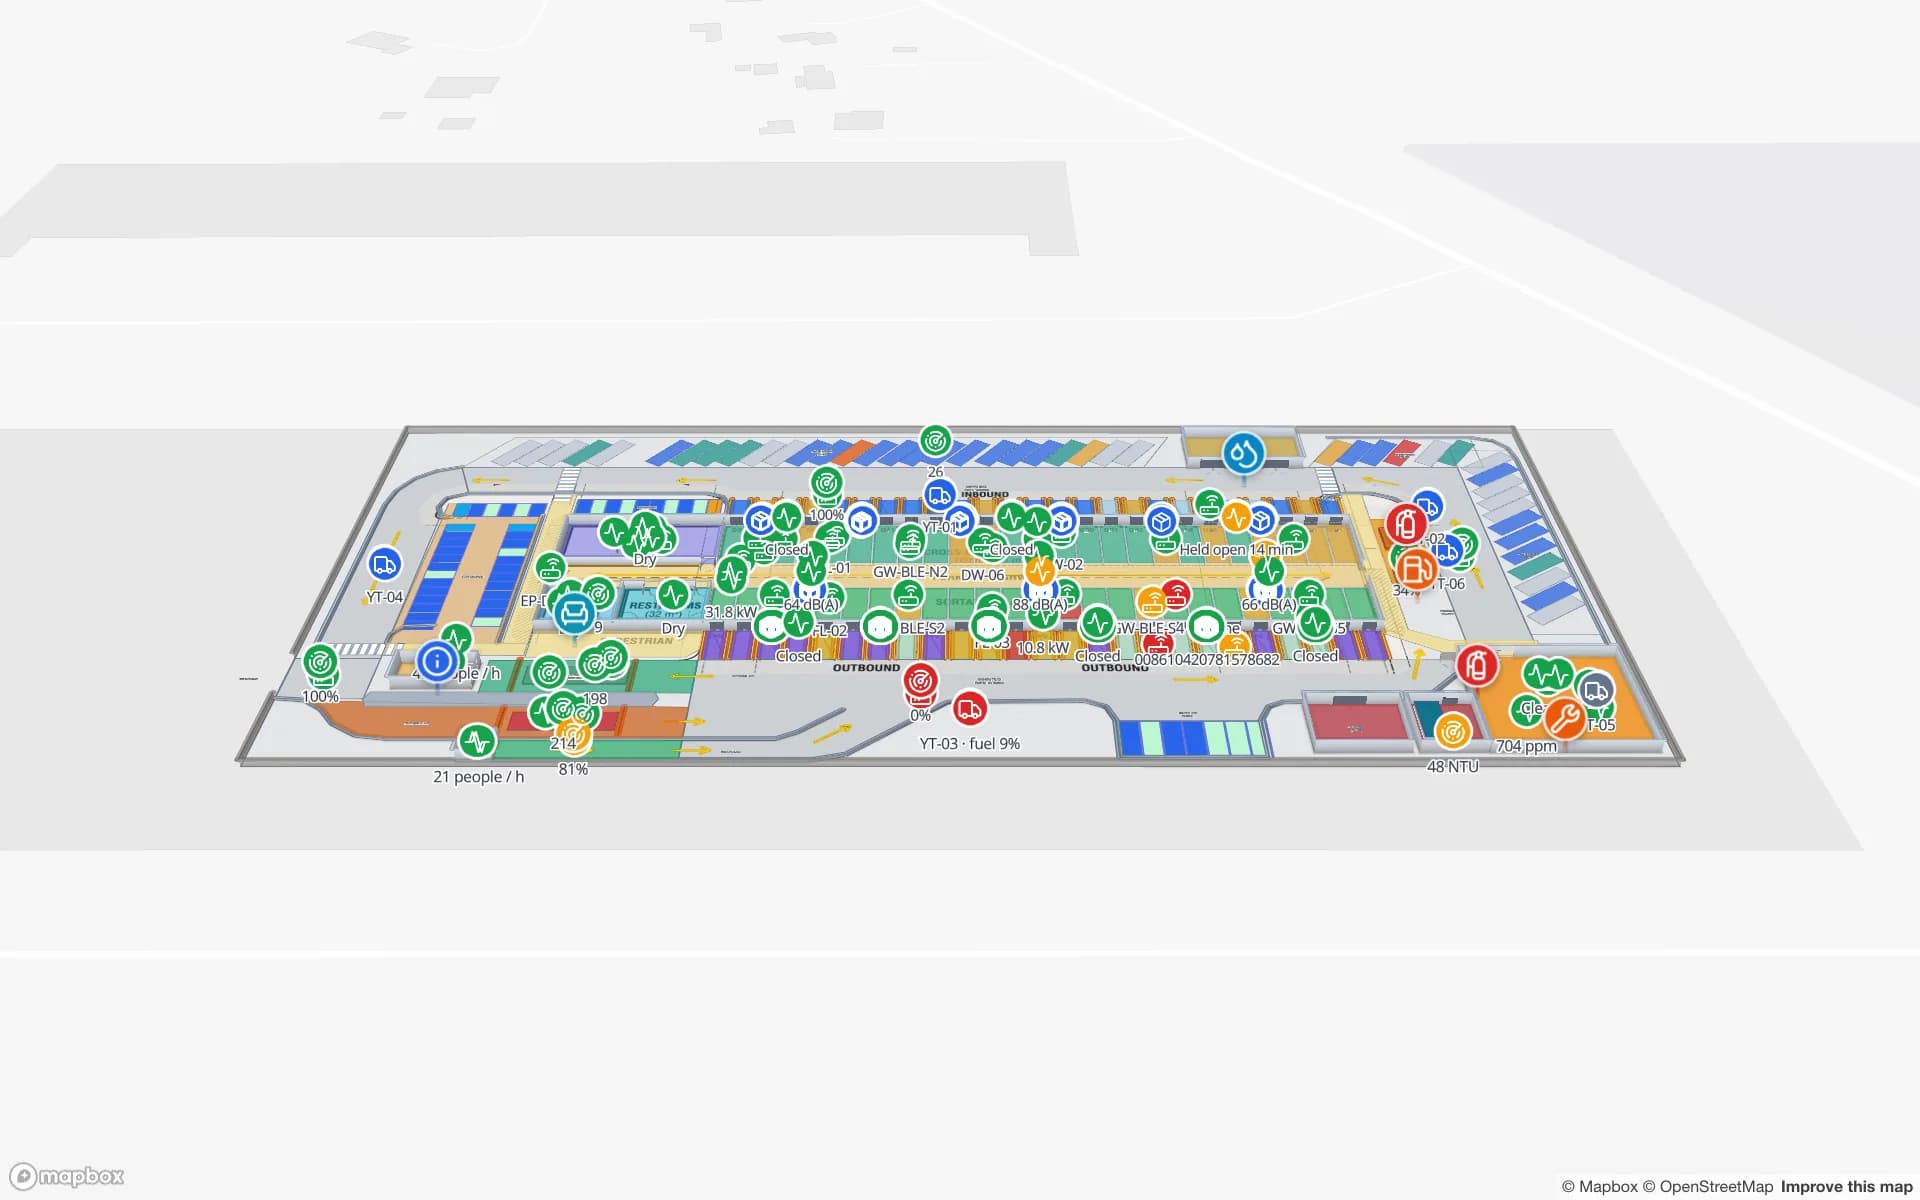
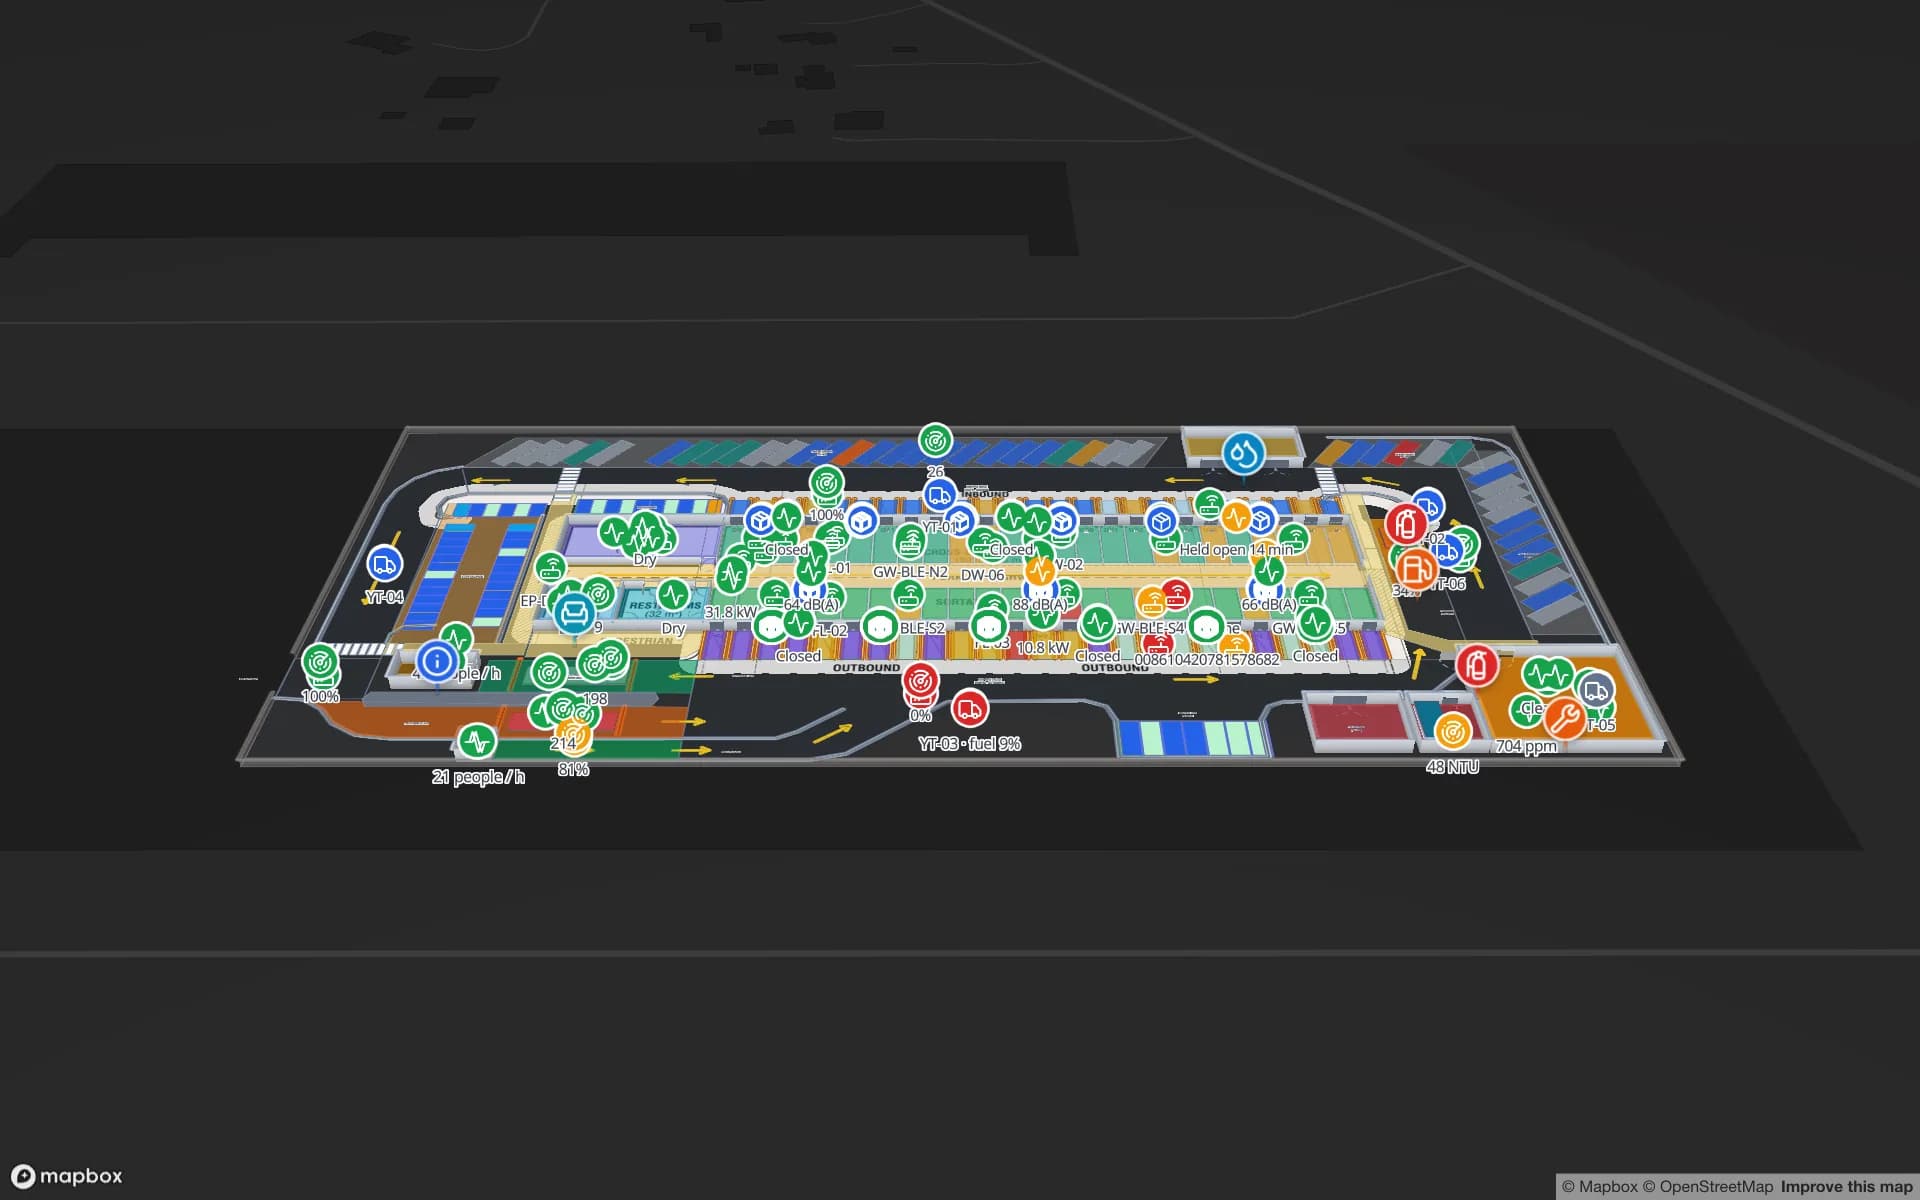
Eastport Cross-Dock Freight Hub, a cross-dock & trailer yard demo, in the Spatial Map 3D viewer with live device markers
Eastport Cross-Dock Freight Hub
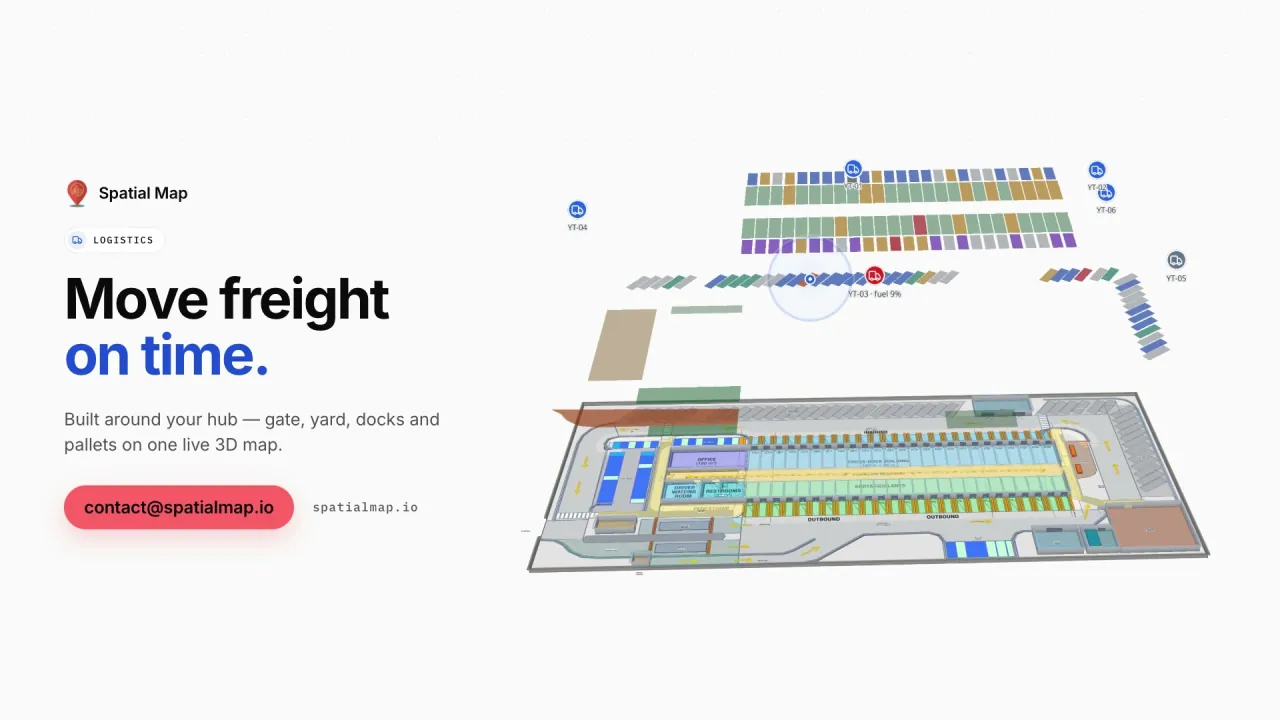
Eastport Cross-Dock, a demo freight hub: 50 dock doors, 44 yard slots, the gate and weighbridge, and 1,180 RFID pallets moving through the cross-dock.
RFID pallets in the Eastport cross-dock demo
1,180
Rack locations in the Crestline fulfilment demo
2,204
How often alert rules are checked
15 s
Free trial, up to 5 facilities, no credit card
7 days

Durban, the N3 and the ports of the Cape

Durban is South Africa’s busiest container port, and most of what lands there travels inland to Gauteng along the N3, the country’s main freight corridor, with a smaller share by rail to the inland terminals around Johannesburg. Cape Town handles much of the Western Cape’s fruit and wine exports, and Ngqura and Port Elizabeth in Nelson Mandela Bay serve the Eastern Cape’s automotive plants.

Around each port, container depots and cross-docks unpack and stage freight against truck slots. Spatial Map draws the dock doors, yard slots, gate and weighbridge on the site plan and colours them from your yard or WMS data, as in the Eastport Cross-Dock demo. It does not connect to the port operator’s or customs systems; it shows what your own reads and records say is in your building. For the inland end, see Johannesburg.
Retail chains and their distribution centres

South Africa has national grocery, clothing and general-merchandise chains with hundreds of stores each, often supplied from large distribution centres in Gauteng, the Western Cape and KwaZulu-Natal — and some also supply stores in neighbouring countries. In those DCs, stock by bin, RFID-tagged cartons at the dock doors, forklifts and the trailer yard belong on one screen.

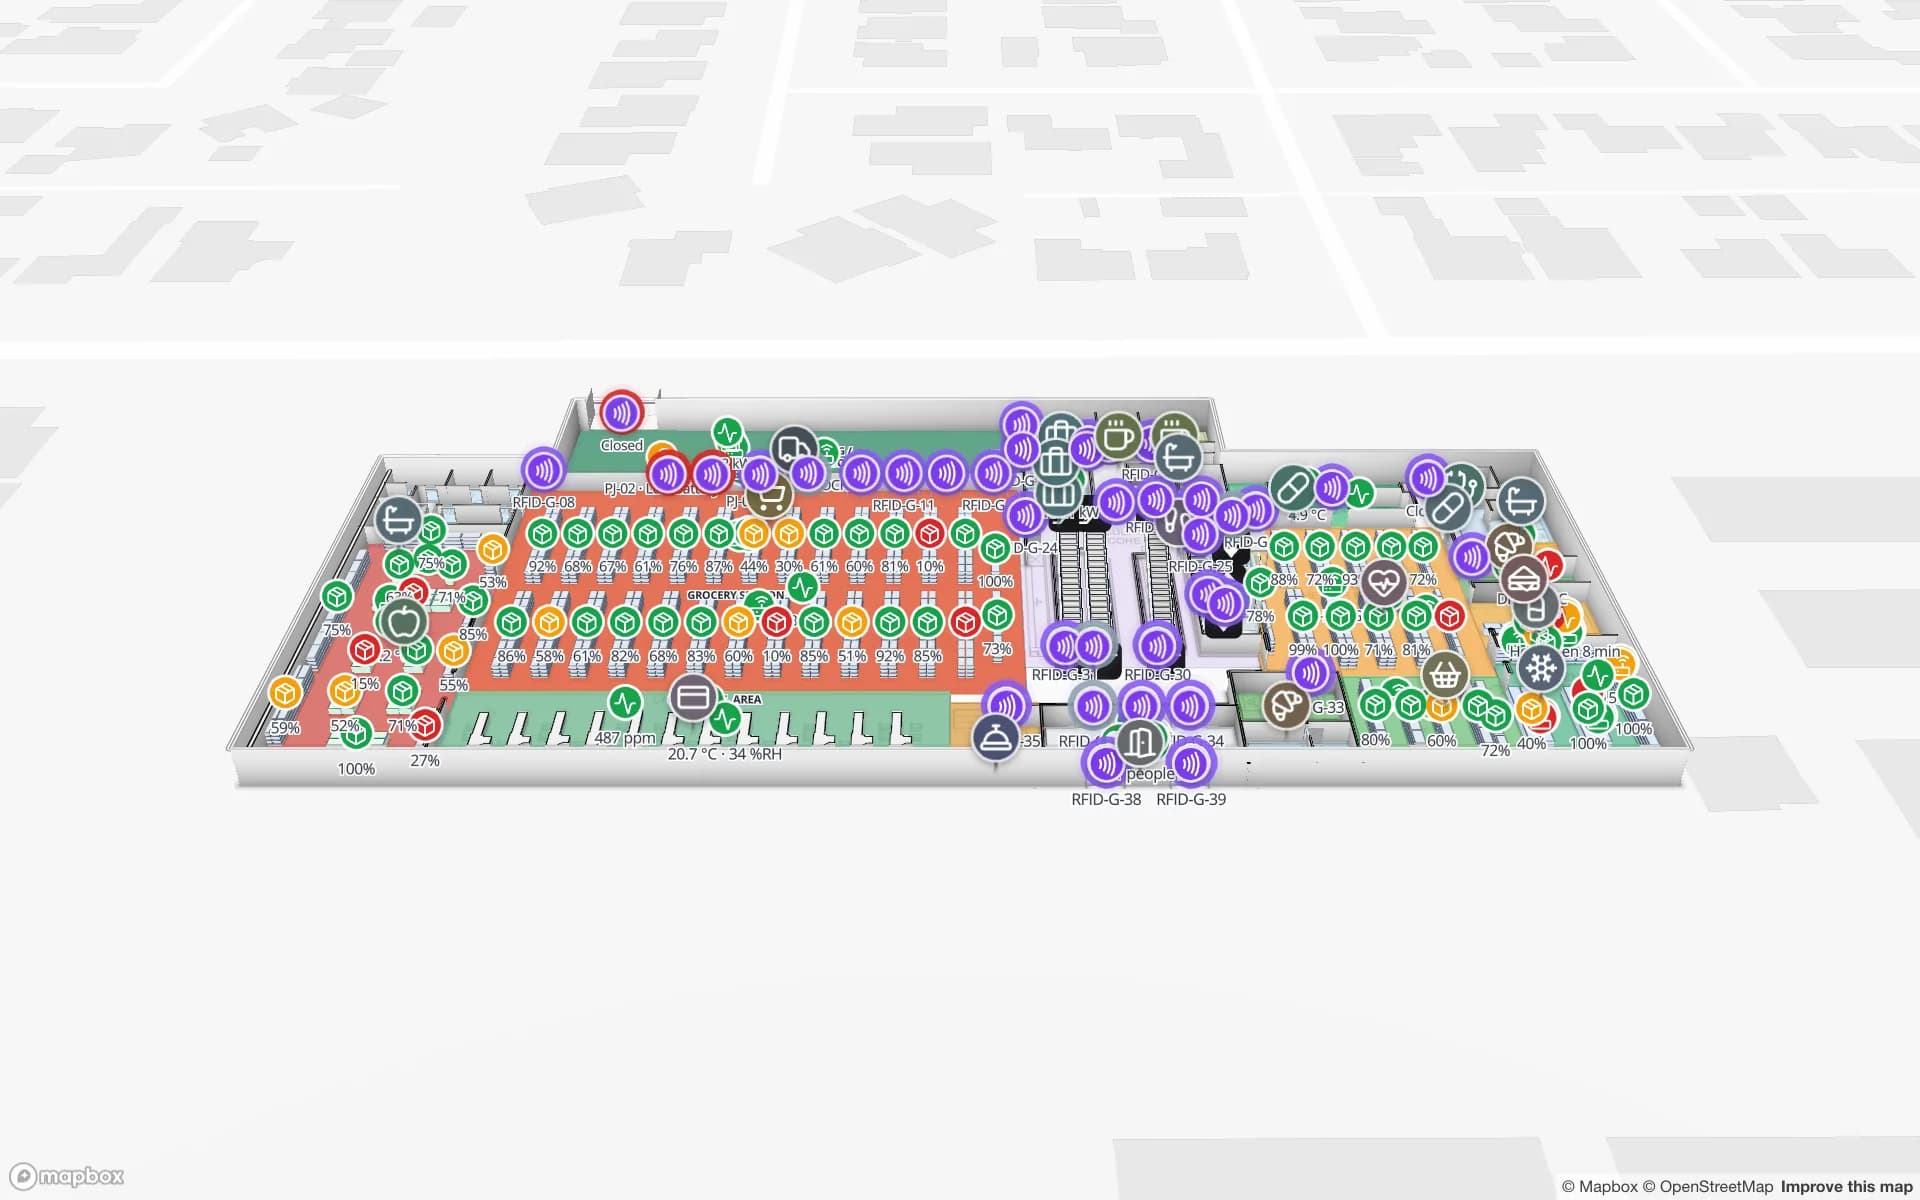
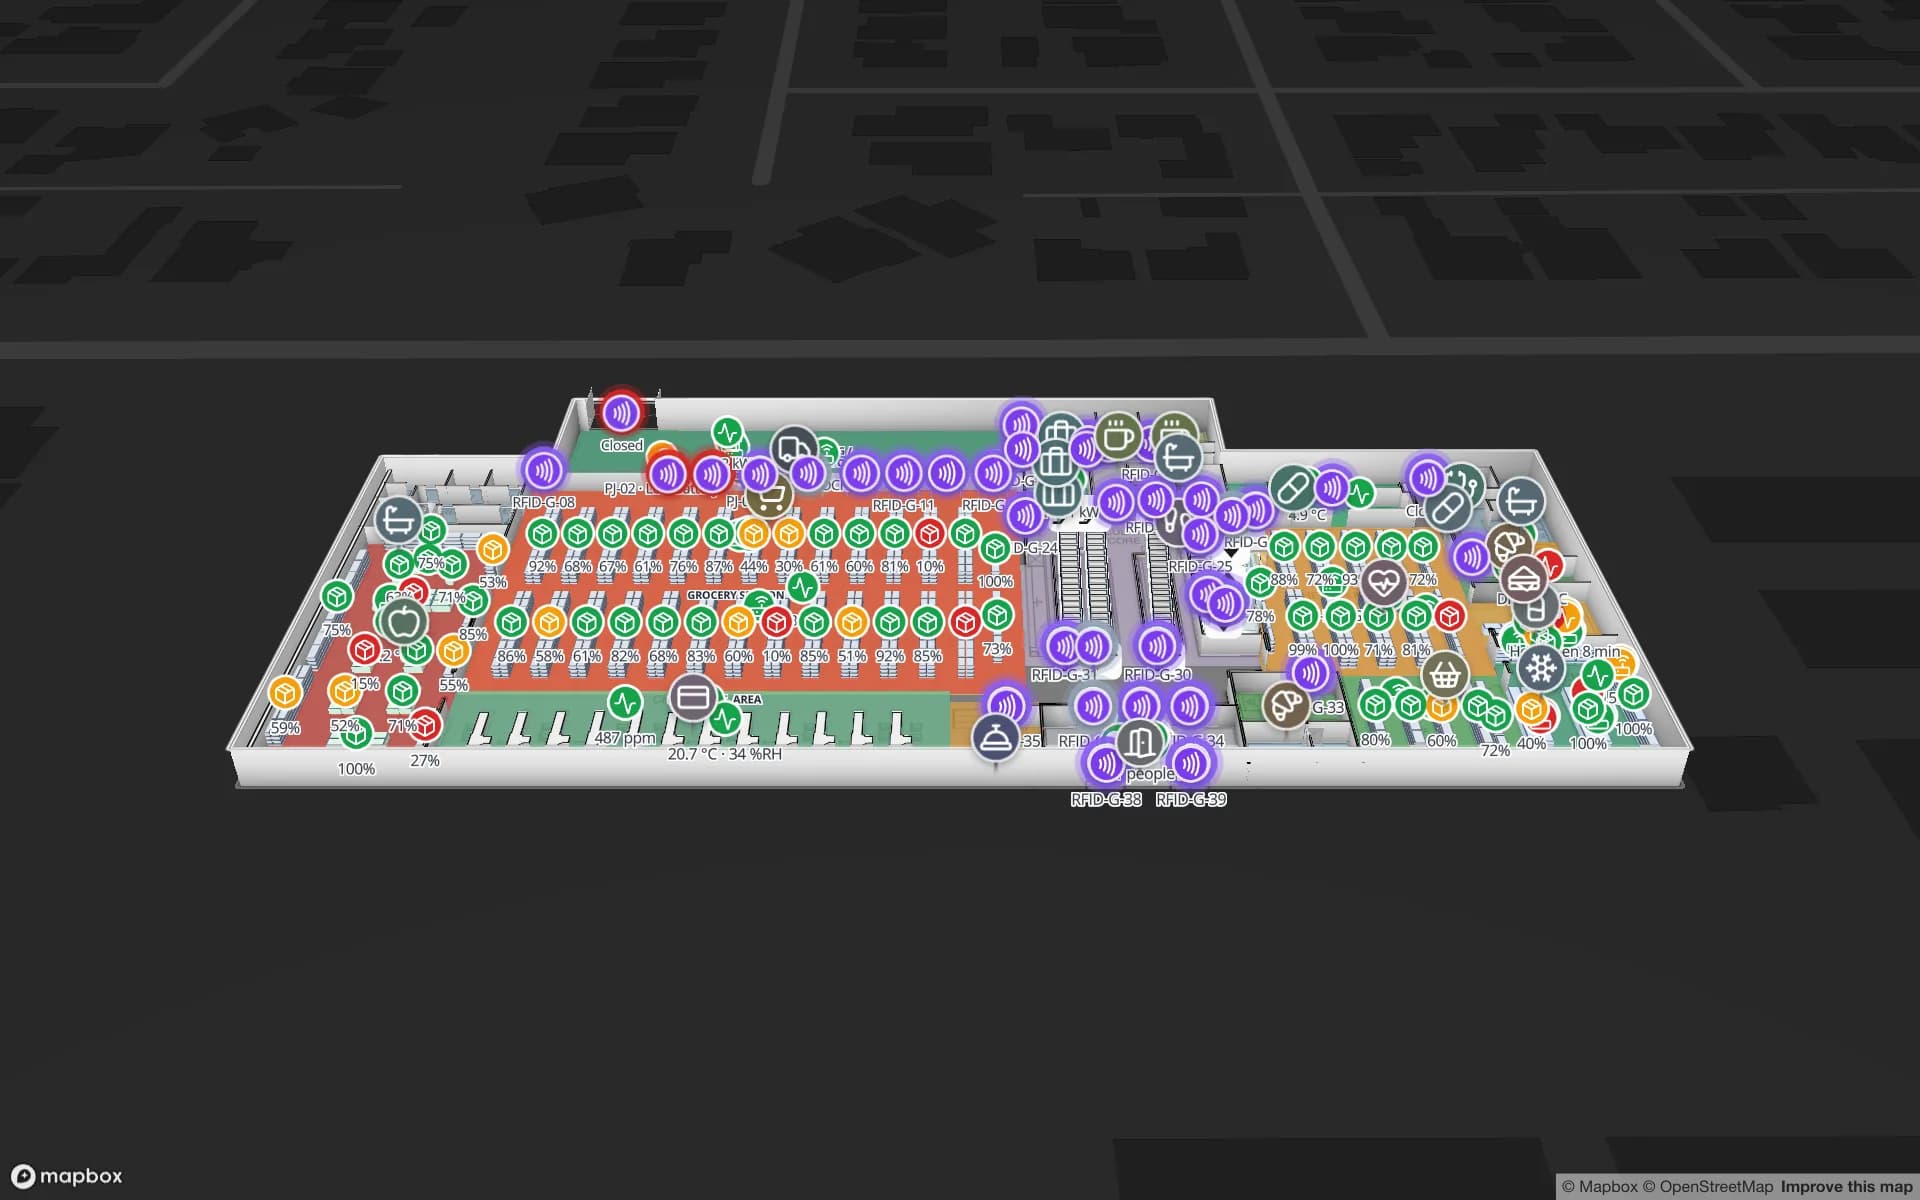
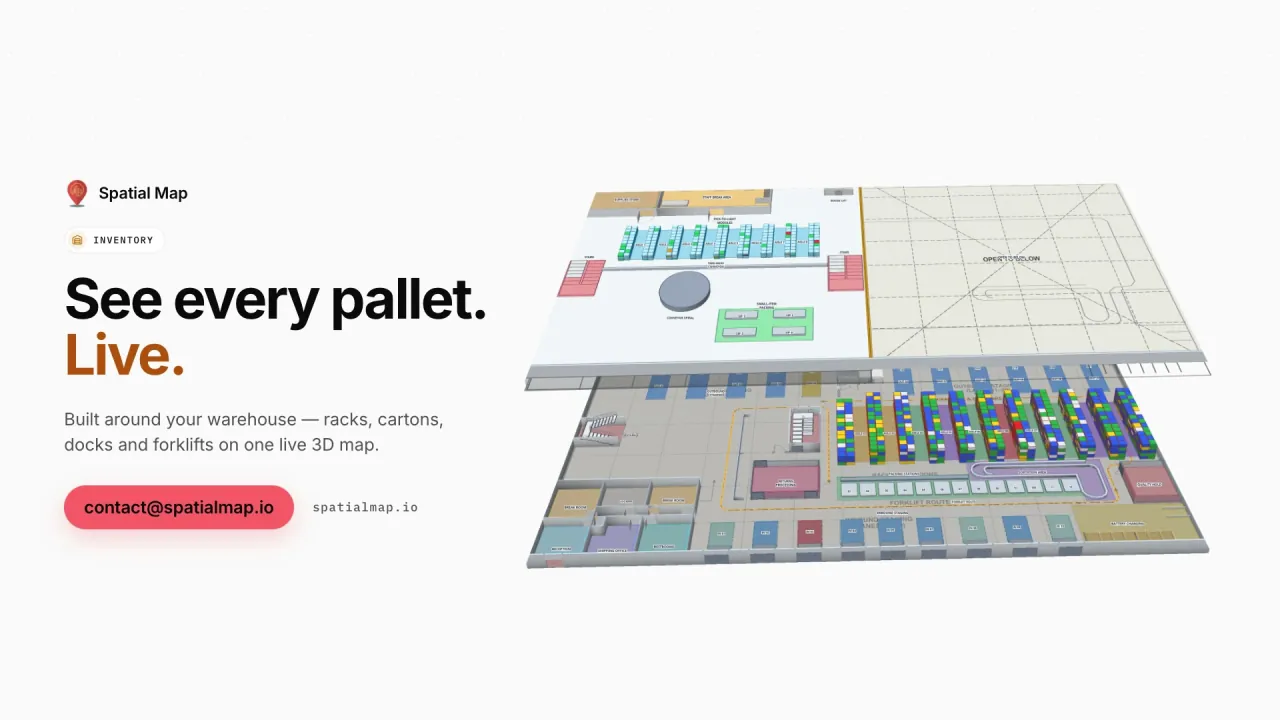
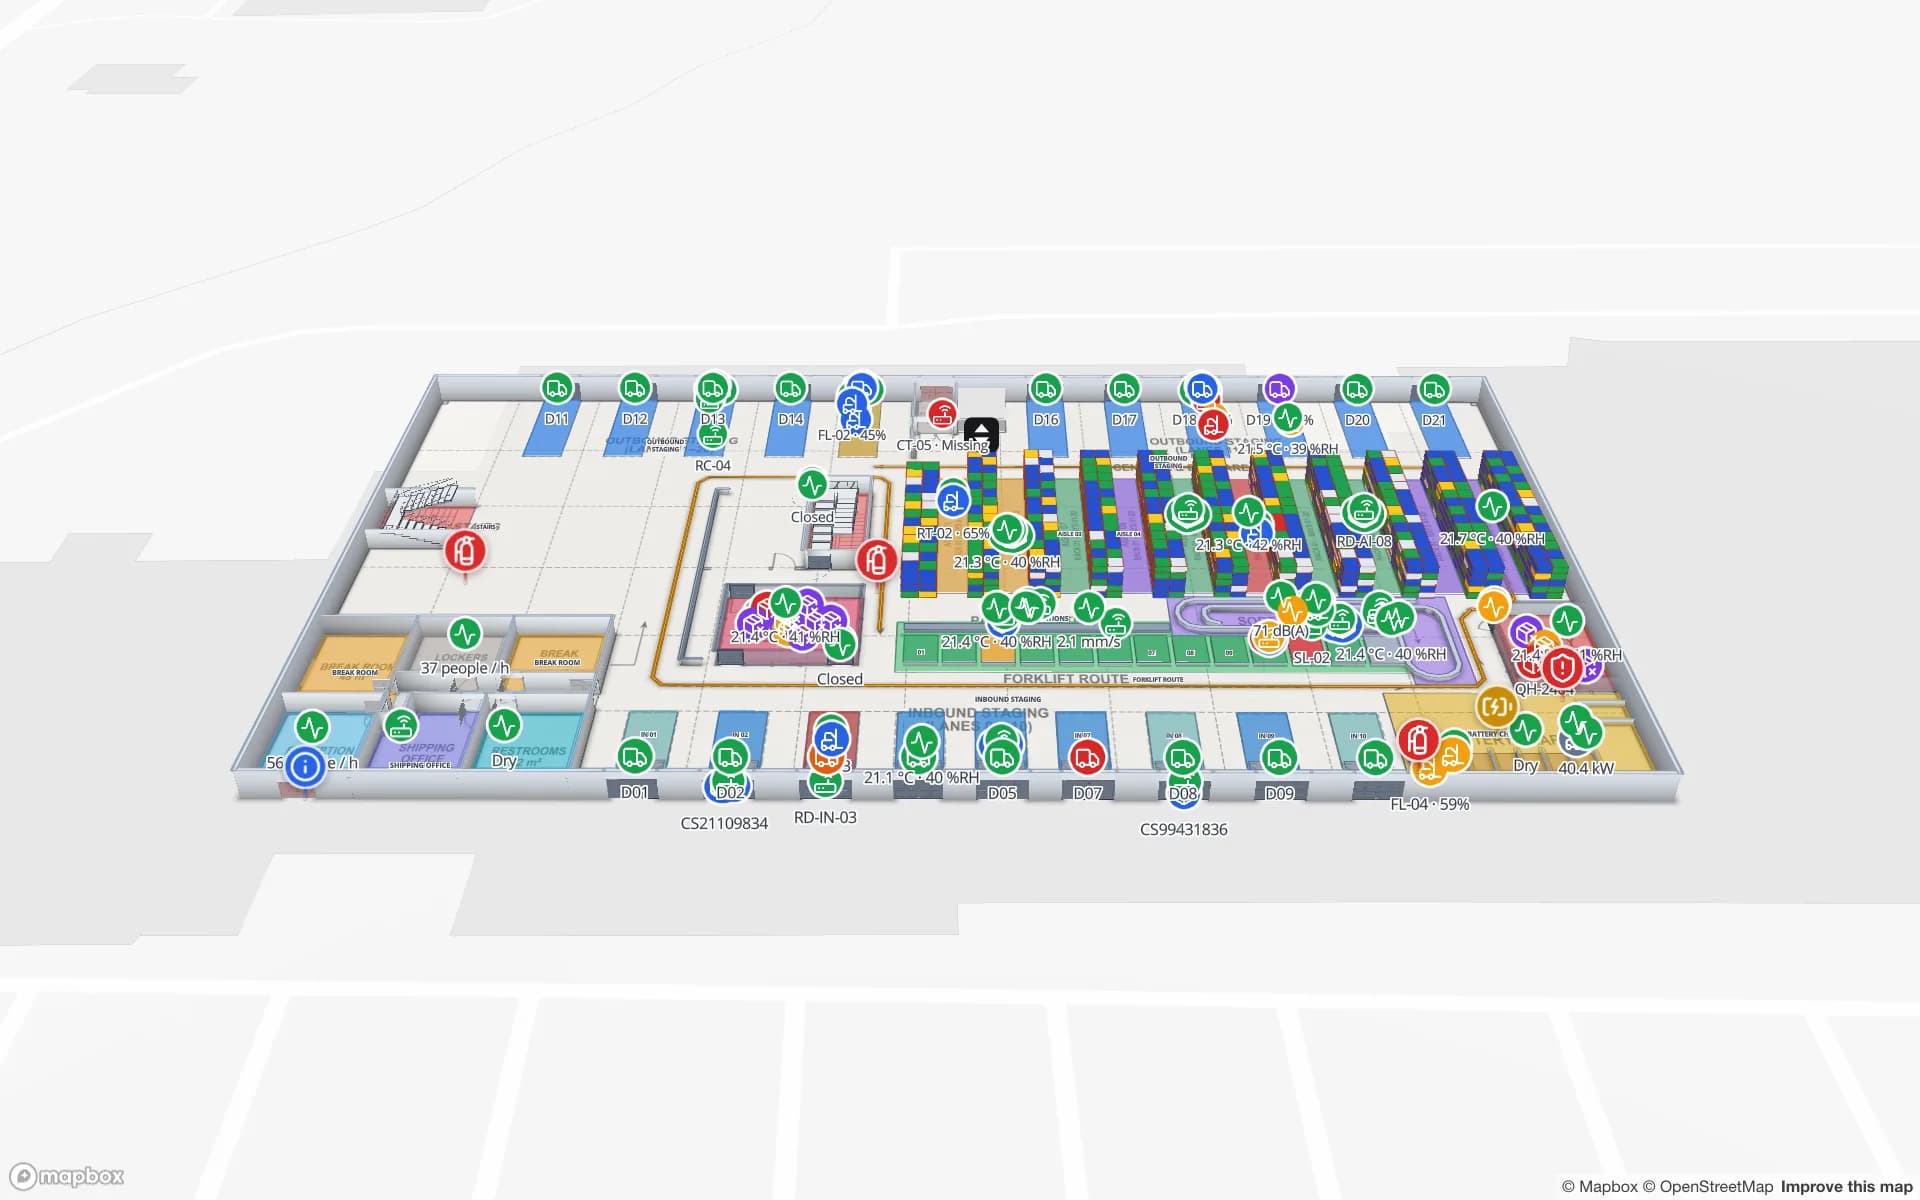
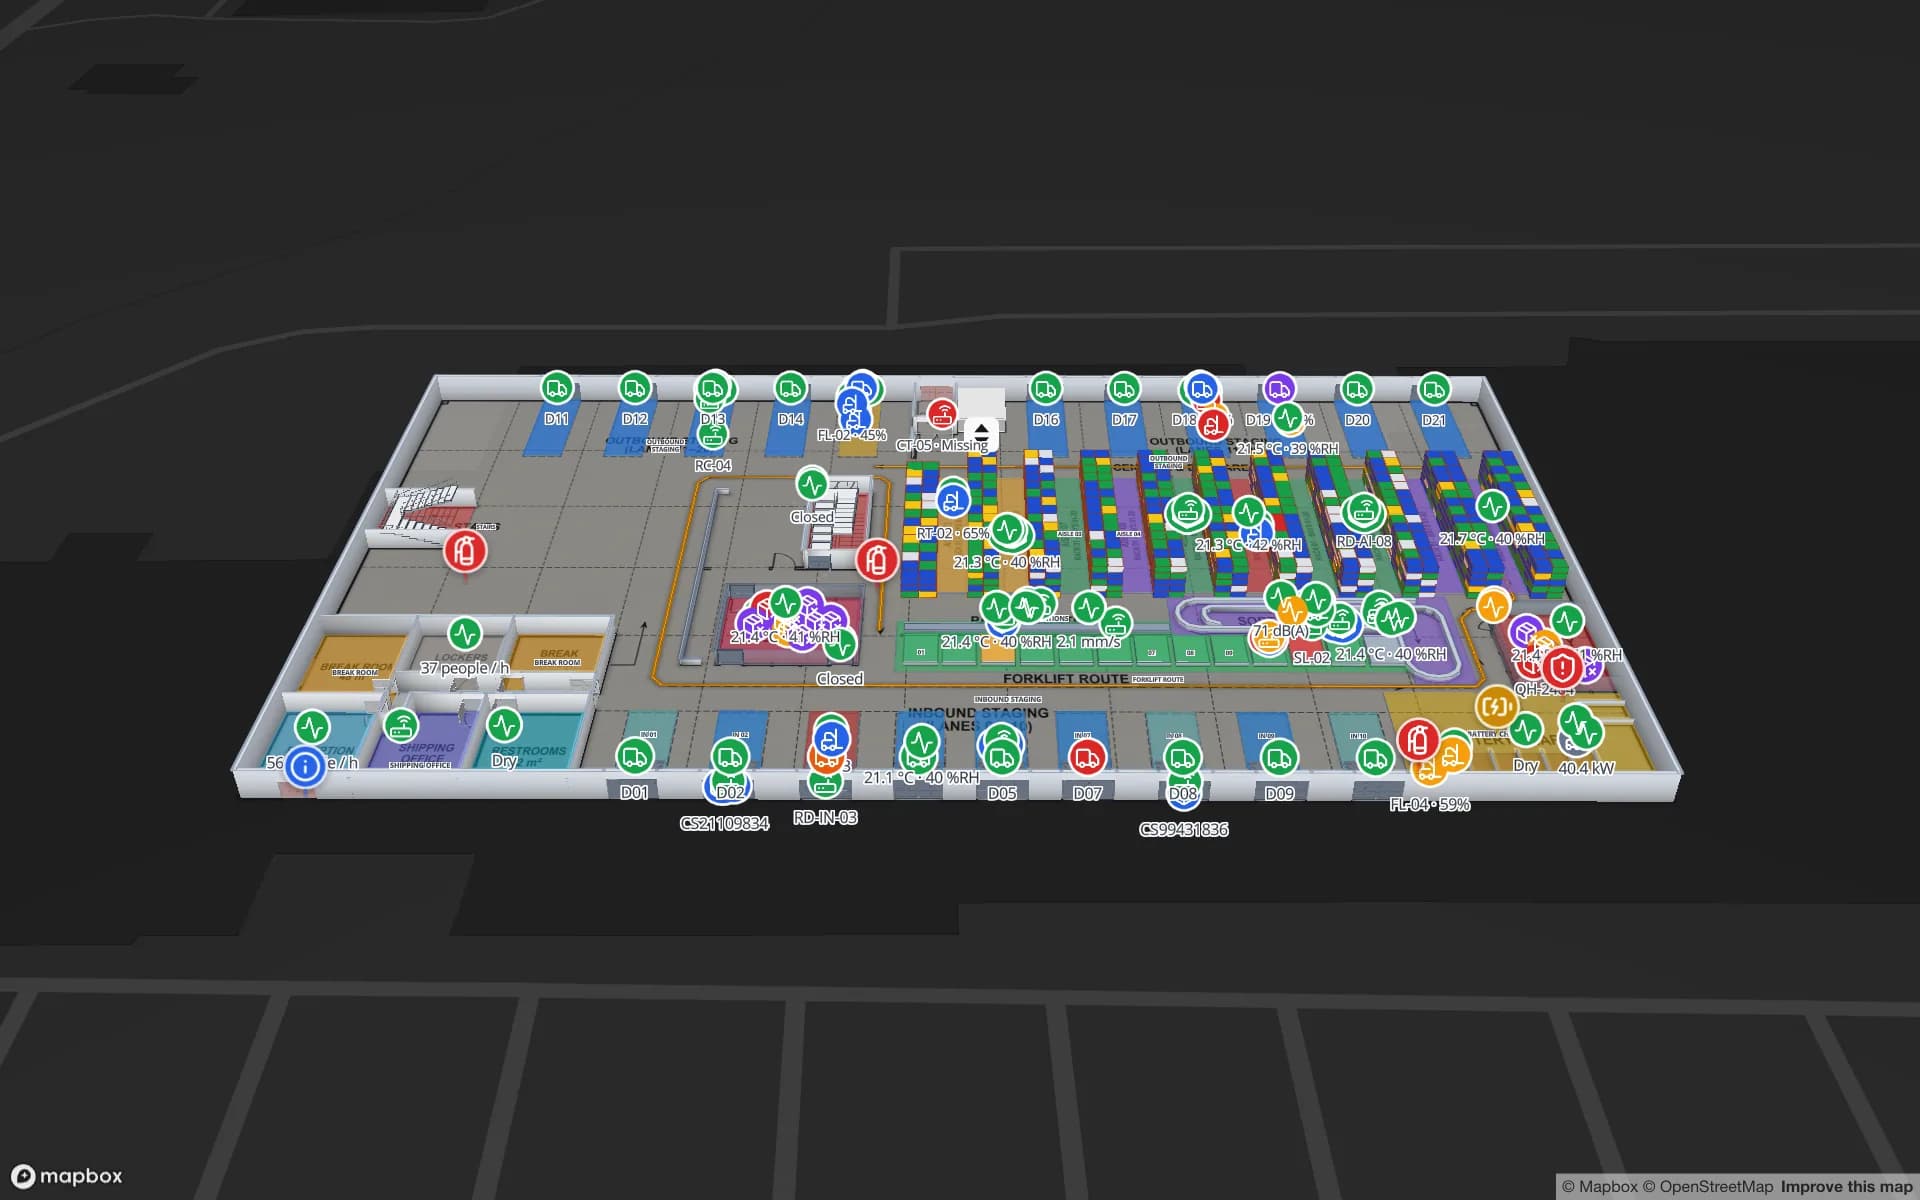
The Crestline Fulfillment demo shows 2,204 rack locations, pick-to-light, packing, staging lanes and the yard. In the store, the Retail Mart demo places 85 RFID readers at the doors, escalators and lifts of a three-floor shop. Item-level RFID for stores is covered on RFID tracking in South Africa.

Mining and industrial supply

Mining has shaped South Africa for well over a century, from the gold of the Witwatersrand to platinum in the Bushveld, coal in Mpumalanga and iron ore and manganese in the Northern Cape. Each mine depends on supply warehouses, workshops and tool stores holding spares that are costly and slow to replace, and many mining and engineering groups manage those stores from offices far from the shaft.

Tag the tools, spares and calibrated equipment with RFID or BLE and let your reader software or RTLS report where they are; Spatial Map shows each item on the store or workshop plan with its check-out history in the detail drawer. Ask AI (beta) can answer plain questions such as how many items are overdue in one store, with links that show them on the map.

Fruit exports and the cold chain

South Africa is one of the world’s largest exporters of citrus, and table grapes, apples, pears and stone fruit add to a large export season. Fruit moves from packhouses in the Western Cape, Limpopo, the Eastern Cape and Mpumalanga through cold stores near the ports to reefer containers.

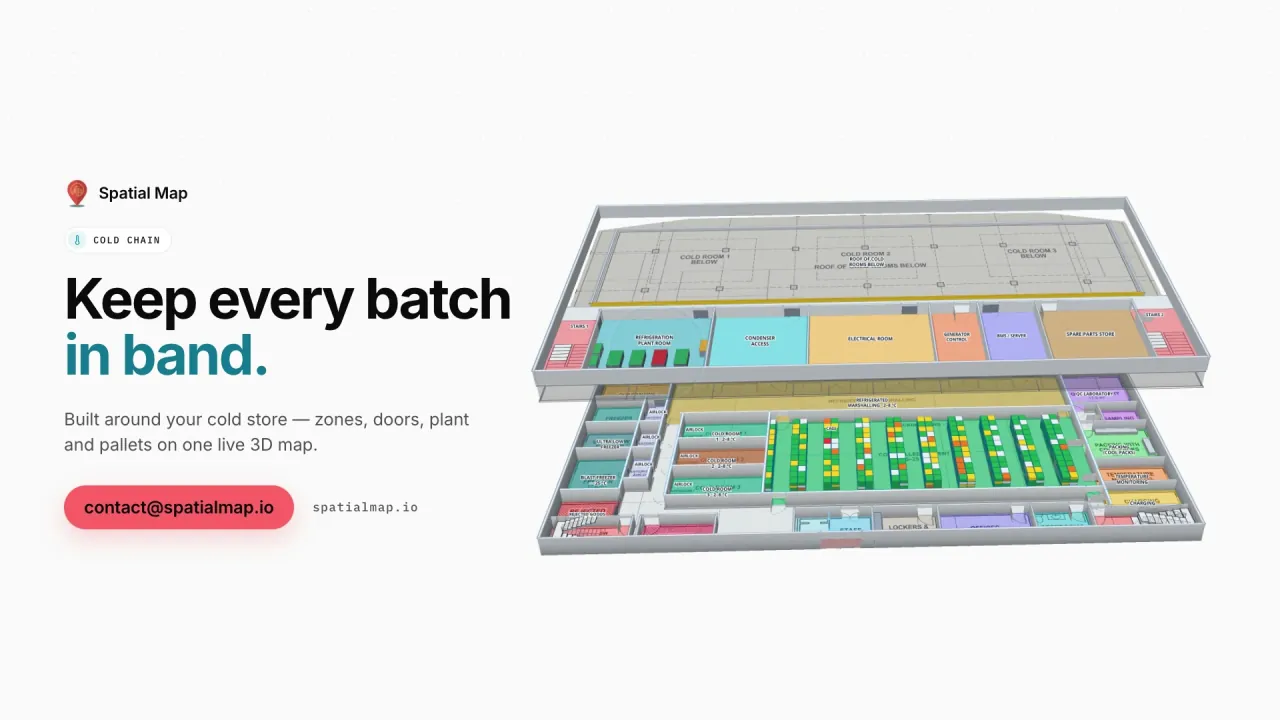
Each cold room on the map takes the colour of its latest reading, pallets on hold show at their bay, and an in-app alert fires when a room stays out of range for a set number of minutes. The Polar Pharma demo shows the same pattern in a pharmaceutical cold store. Your QA system and export documentation stay the record; see the cold-chain solution.

Load-shedding, POPIA and working with us

Years of scheduled power cuts — load-shedding — mean many sites run on backup power and lose their network link now and then. Viewing the map needs a connection, but data can be buffered by your middleware or a small relay and posted in batches when the link is back, and a “not updated for N minutes” alert rule shows which sensor or gateway went quiet.

Where data relates to identifiable people, the Protection of Personal Information Act (POPIA), overseen by the Information Regulator, is the context; your legal advisers decide what applies, and many projects tag stock and equipment rather than staff. A data processing agreement is available. Spatial Map is sold online at the same USD price worldwide, and our team works with South African customers remotely through the contact form.

How Spatial Map does it

From floor plan to live map

  1. 01

    Import the floor plan

    A PDF, a DWG from AutoCAD R2004–R2018 or a scan of the DC, store or cold store.

  2. 02

    Draw the building

    Racks with their locations, dock doors, cold rooms, tool stores, stairs and lifts.

  3. 03

    Connect WMS, RFID and sensors

    Post rows to a table in batches, or let Spatial Map poll your REST endpoint.

  4. 04

    Run it nationally

    Group sites into solutions, watch in-app alerts and share read-only links with clients.

What South African teams use it for

Port-side cross-docks

Dock doors, yard slots and RFID pallets staged for the N3 trucks.

Retail distribution centres

Rack-level stock, pick-to-light and the trailer yard on one map.

Mine supply stores

Tagged tools and spares with check-out history and overdue items.

Fruit cold stores

Cold rooms by live temperature, with in-app alerts on excursions.

See it on real demo facilities

Fictional names, real floor plans, live sensors, RFID, BLE tags and gateways — open any of them in the browser.

All 13 demo facilities

Questions from South African teams

The map itself runs in the cloud, so it needs a connection to view — a site on backup power and mobile data can still open it. Readings collected during an outage are posted in batches when the link is back, and a “not updated for N minutes” alert rule shows which devices went quiet.

Spatial Map processes the data you send it, roles limit who sees each facility, and a data processing agreement is available. Whether a particular use — especially tracking employees — is lawful is for you and your legal advisers to assess, with POPIA and the Information Regulator’s guidance as context.

No. Spatial Map shows your own warehouse: dock doors, yard slots and pallets coloured by your reads and WMS data. Port bookings and customs records stay in their own systems.

No. Spatial Map is sold online and our team works with South African customers remotely, by video call and through the contact form. Nothing is installed on site.

No. Pricing is the same worldwide and in US dollars: a 7-day free trial for up to 5 facilities with no credit card, then Pro at $60 a month or $600 a year for up to 4 facilities. Larger networks are quoted as custom services.

Map your first South African site this week.

Start the free trial, or send us a floor plan and a sample of your WMS, RFID or sensor data through the contact form and we will show you your own building live.