Basel · Rhine ports, EuroAirport and the tri-border logistics

Temperature monitoring in Basel, from the Rhine port to the cold room

Spatial Map colours every room, zone and cold store of a building by the live reading from its probes, and keeps the history so you can replay what happened. Temperature monitoring in Basel is shaped by geography: goods arrive by barge, rail and truck at the Rhine ports, leave by air from an airport that sits in France, and wait in between in warehouses in two cantons and two countries. Each building is its own facility on its own map, and all of them can sit in one workspace.

No credit card. Runs in the browser. Pro is $60/month for up to 4 facilities. Book a demo

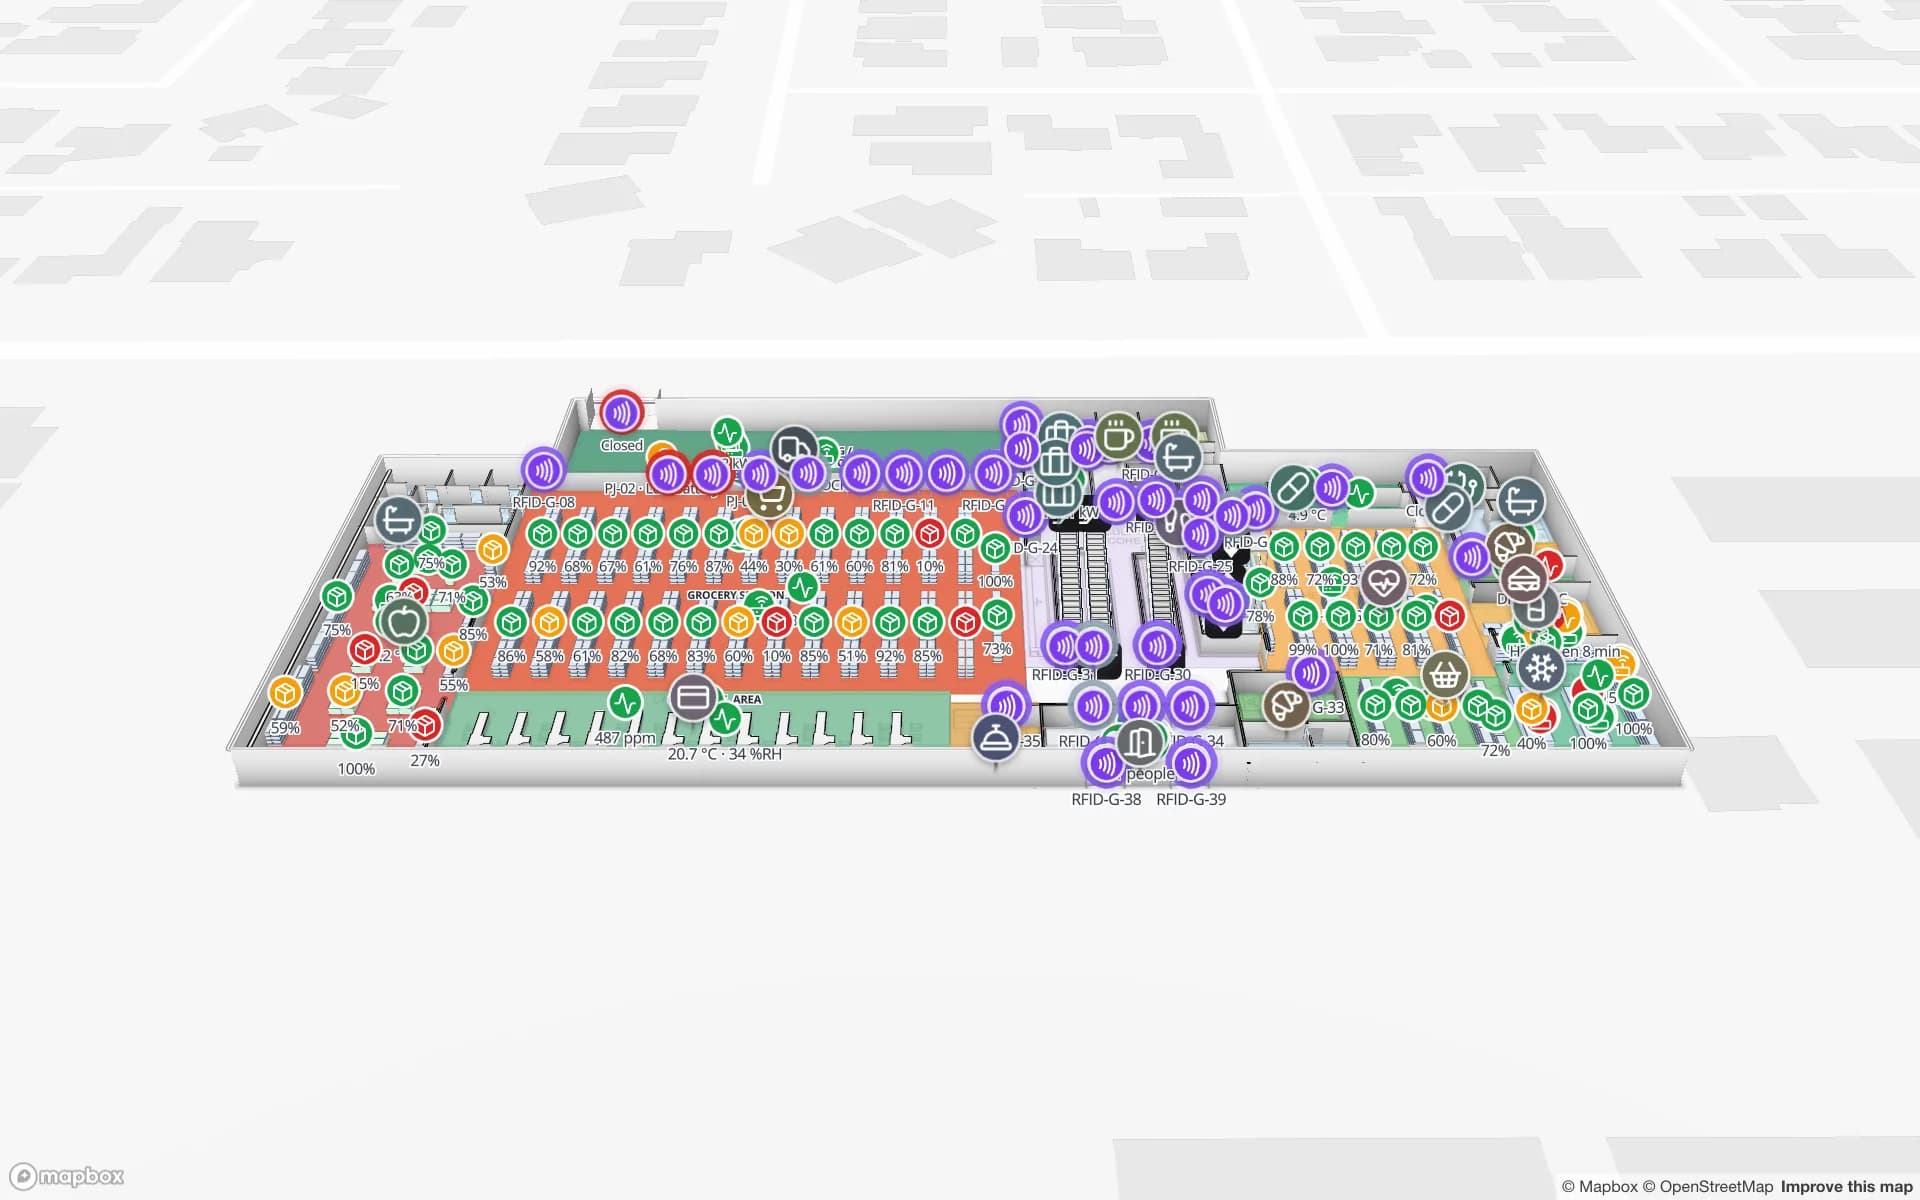
Polar Pharma — Cold Storage & QC Facility, a pharmaceutical cold store & qc lab demo, in the Spatial Map 3D viewer with live device markers
Polar Pharma — Cold Storage & QC Facility
Polar Pharma, a demo cold store and QC facility on two floors: temperature zones tinted from probes, door sensors, quarantine, reefer docks and 1,140 rack locations.
Rack locations in the Polar Pharma cold-store demo
1,140
Floors in the Polar demo, with reefer docks and a QC laboratory
2
How often alert rules are checked, with alerts shown in the app
15 s
Free trial, up to 5 facilities, no card
7 days

Switzerland’s gate on the Rhine

The Swiss Rhine Ports in Basel, Birsfelden and Muttenz have worked together since 2008 as the “Tor zur Schweiz”, with about 80 port companies. For 2025 they report 4.7 million tonnes handled, 11.3 % less than a year earlier; imports of mineral oil and energy products, down 22 %, account for over 90 % of that fall. Containers went the other way: 112,620 TEU on the water side (+12.6 %) and 50,197 TEU by rail, 51.5 % more than in 2024. The ports also note that Rhine water levels were around average except for one low-water period in spring.

For a warehouse behind a port gate, the quiet risk is time: a barge held back by low water, a container waiting for a train slot, a pallet staged in a hall that is warm by mid-afternoon. A map that shows the hall as a heat picture, with probes as value badges, answers “which corner is worst?” faster than a spreadsheet of logger IDs. Warehouse temperature mapping walks through the method, and the Crestline demo shows temperature and humidity readings across storage zones.


Grain, feed and food in the silos

The ports’ 2025 report counts agricultural imports of 185,069 tonnes, 9.7 % more than the year before. The reason is a very weak domestic harvest in 2024, which led to above-average grain imports for the food and feed industries; the federal government also raised the import quotas, and in the second half of the year silo capacity in the ports was at times very well used. The report also notes that coffee traffic has been shifting from road to rail and ship.

Stored grain and feed are watched by temperature, because a warm spot is where trouble starts. Silos are rarely drawn as buildings; draw each cell as an area or a circle on the site plan, post one row per probe or cable with its reading, and let a data link colour the cell by its warmest value. An alert rule set to a threshold, or to “not updated for N minutes” when a probe goes quiet, raises an in-app alert and Show on map takes the shift lead to it. Spatial Map does not read probes itself: your logger system or gateway posts the rows through the table write API or a REST endpoint it polls.

EuroAirport: one airport, two countries

The EuroAirport Basel-Mulhouse-Freiburg calls itself the world’s only binational airport. It stands on French territory under a Franco-Swiss convention signed in Bern on 4 July 1949, which lets Swiss authorities inspect travellers and goods bound for Switzerland in a delimited zone and apply Swiss law there; the customs road to Basel opened in 1952. In 2025 it handled 101,700 tonnes of cargo, against 104,800 tonnes in 2024 and 96 % of the 2019 volume.

For a cargo handler or a shipper, that means one pallet may sit in a French-sector hall or a Swiss-sector hall depending on where it is going, and in a chilled room in either. Treat each building as a facility, draw its cold rooms and staging areas, and colour them from the same table of probes. Alerts can be written for a staging area that stays warm for ten minutes or a room that stops reporting; your own process defines what to do next, and the alert stays in the app. The Polar Pharma demo shows reefer docks and cold rooms on one map.

Cold rooms around a life-sciences city

Basel sits at the centre of a life-sciences cluster that already has a page on Switzerland: research, production and logistics close to the French and German borders. What this means for monitoring is mostly a matter of density: many mid-sized cold rooms, freezers, controlled-ambient stores and reefer docks within a few kilometres, each with its own probes and logger.

The Polar Pharma demo draws cold rooms, freezers and controlled-ambient storage with 1,140 rack locations, door sensors that show which cold room is open, quarantine and returns areas, and the QC laboratory. History can be replayed in the History player and reports exported to PDF or Excel. Spatial Map makes no compliance or validation claim: your quality system remains the record, and the map makes the state of the building visible between audits. See also pharma cold storage and QC temperature monitoring and the temperature monitoring overview.

Services for teams in Basel

Basel teams tend to follow this order:

  • Warehouse and port-logistics teams start with temperature monitoring of the halls and stores they already log by hand, then add inventory tracking for pallets and lots.
  • Cold-room operators begin with the probes they already own: import the plan, draw each room as an area, and post readings from the logger system.
  • Teams moving goods between buildings, sites or countries add asset tracking for returnable boxes, loggers and pallet shippers.
  • If you have no probes, gateways or tags, our team can source them on request, quoted per project, with warranty and device support from the manufacturer: see BLE beacons and gateways on request and hardware and demo kits.
  • Where a logger system has no export, our team builds the bridge as a client project: custom software development. Run it as cloud or on-premises when data must stay on your own servers.

Also served nearby

The same page covers Pratteln, Muttenz, Birsfelden, Allschwil and Liestal in Basel-Landschaft, Weil am Rhein and Lörrach in Germany, and Saint-Louis and Huningue in France; a workspace can hold buildings in all three countries. The app is available in German, French and English, so colleagues across the border can work in their own language.

How Spatial Map does it

From logger sheet to live temperature map

  1. 01

    Draw the rooms

    Upload the plan or a photograph of a sketch and draw each cold room, freezer, hall or silo cell as an area; AI Map can draft the floor for a person to review.

  2. 02

    Make one row per probe

    A table with probe ID, room, last reading and time, uploaded from CSV or Excel to start.

  3. 03

    Post readings from your logger system

    The write API takes bulk upserts over HTTPS with a bearer key; or Spatial Map polls a REST endpoint on a schedule.

  4. 04

    Add rules and a weekly report

    Threshold and silence rules with in-app alerts, the History player for what happened, and a PDF or Excel report.

What Basel teams monitor

Cold rooms, freezers and reefer docks

Zones tinted from probes, with door sensors and the quarantine area on the same map.

Port and airport warehouses

Temperature and humidity across storage zones, with a heat picture of each hall.

Pallets between buildings and borders

Pallets and returnable boxes read at the dock and followed between buildings.

Supermarket fridges and freezers

Cold-chain sensors on fridges and freezers, with temperature markers on every floor.

See it on real demo facilities

Fictional names, real floor plans, live sensors, RFID, BLE tags and gateways — open any of them in the browser.

All 13 demo facilities

Temperature monitoring in Basel — questions we get

No. It displays readings that your probes, loggers or gateways produce. Your logger system or an integrator posts them to a table through the write API, or exposes a REST endpoint that Spatial Map polls; if you do not have probes yet, our team can source them on request.

We make no compliance, validation or certification claim. Your quality system and your own validated records stay the record; Spatial Map shows where each reading was taken and how the building looked at the time, and can replay history and export reports.

Alerts are in-app only: a bell, a toast and the Alerts page, shown to the roles or members you choose, with a severity, a message and Show on map. Rules are checked every 15 seconds. There is no email, SMS or push, so a night shift needs the app open or another system doing the paging.

Yes. Each building is a facility and facilities can be grouped into a named solution; roles decide who sees which. Facilities can be placed anywhere on the map, and the interface is available in German, French and English.

No. Spatial Map is sold online and our team works with customers in Switzerland remotely, by video call and through the contact form, in German, French or English.

In US dollars, the same worldwide and not in francs: a 7-day free trial for up to 5 facilities with no card, then Pro at $60 a month or $600 a year for up to 4 facilities. Probes and gateways, if you ask us to source them, are quoted per project and are not part of the subscription.

Put one Basel cold room on a live map this week.

Start the free trial and open the Polar Pharma demo, or send us a plan and a sample of your logger export through the contact form.