Hyderabad · Genome Valley, cold rooms and the airport cargo zone

Temperature monitoring in Hyderabad for pharma plants, cold rooms and warehouses

Spatial Map puts temperature readings on a live 3D map of the building they come from, so a cold room, a freezer or a warm corner of a warehouse is a coloured area, not a row in a log. Temperature monitoring in Hyderabad is mostly a life-sciences story: biotech and pharma sites in Genome Valley and the industrial belts around the city, a cargo terminal at the airport built around pharma freight, and summers that test every uncooled shed. Your sensors measure; Spatial Map shows where, and rings an in-app alert when a rule trips.

No credit card. Runs in the browser. Pro is $60/month for up to 4 facilities. Book a demo

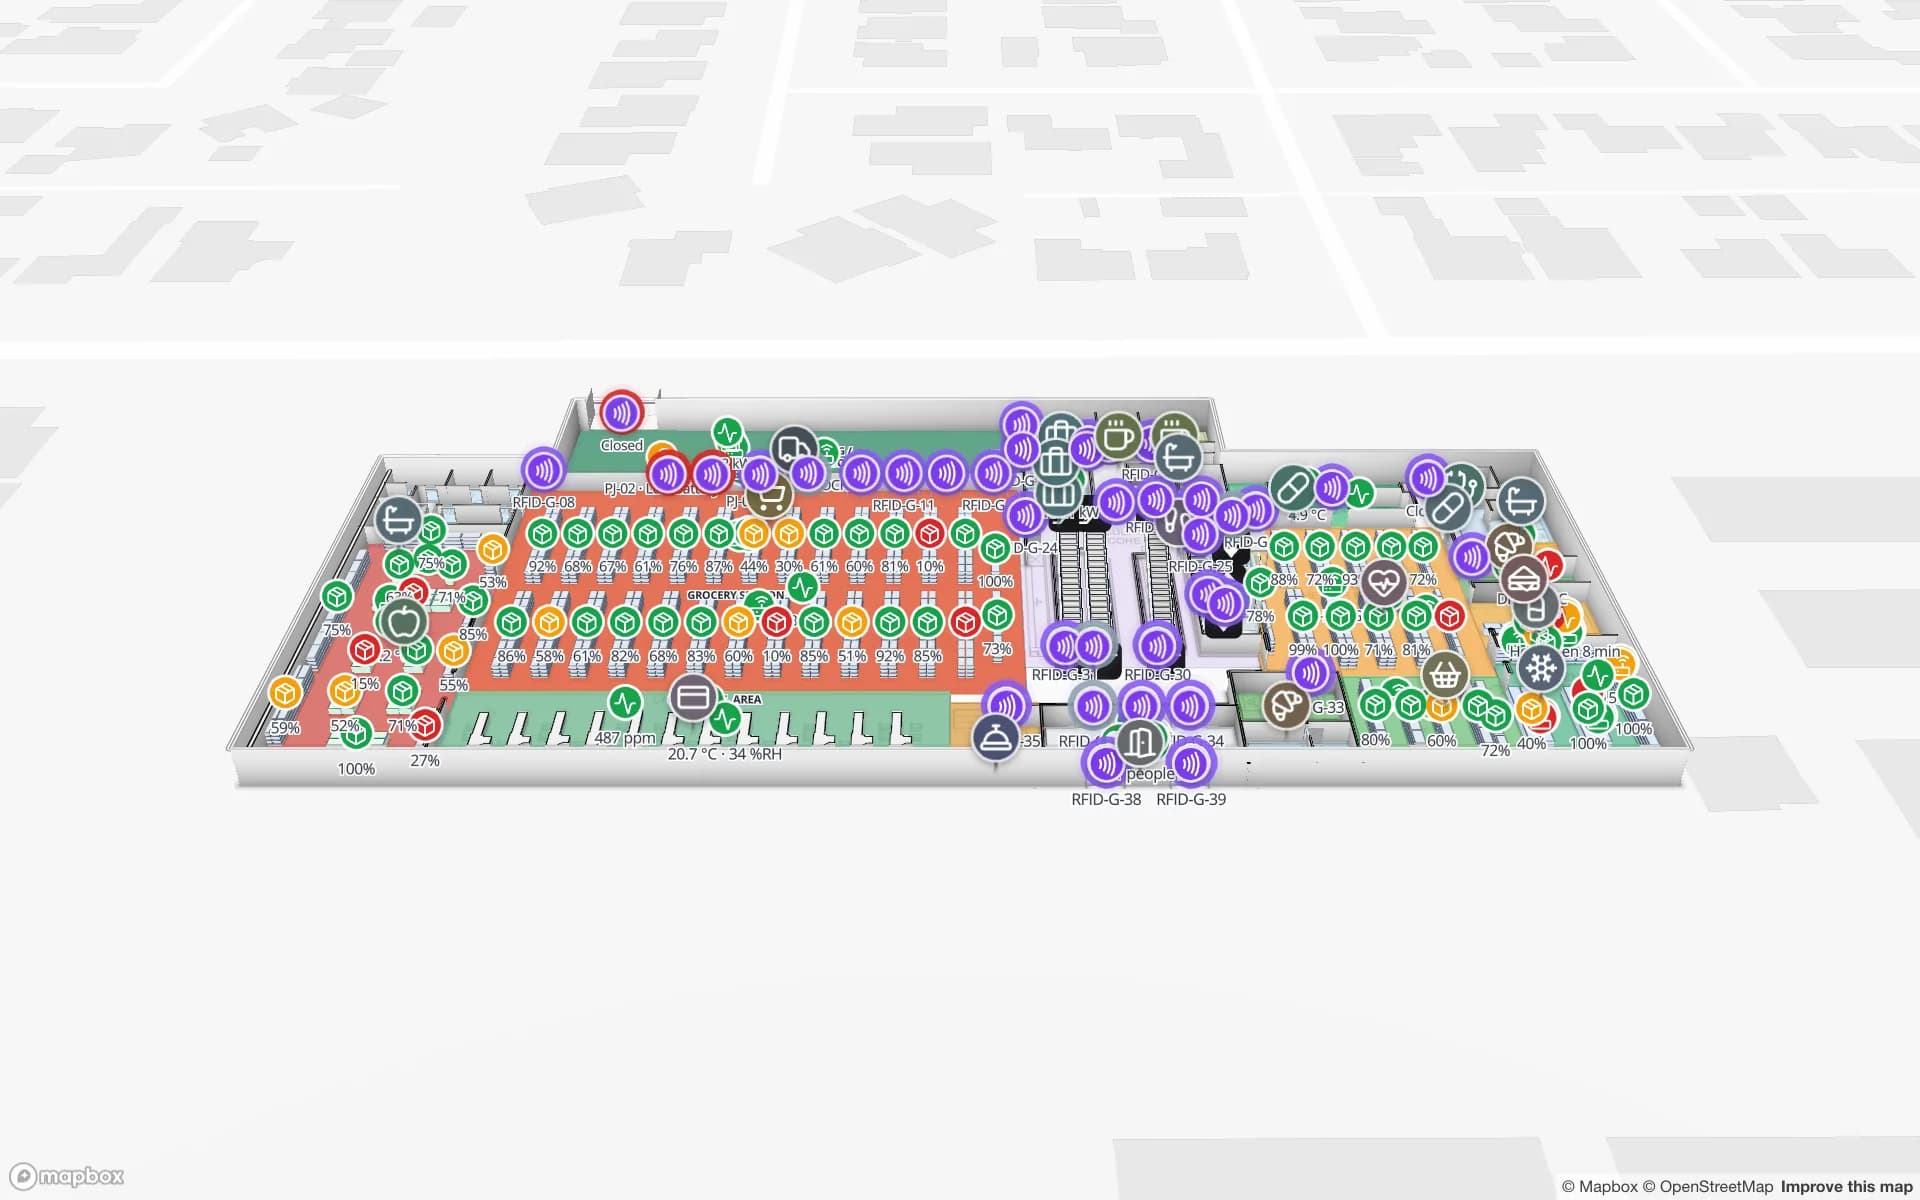
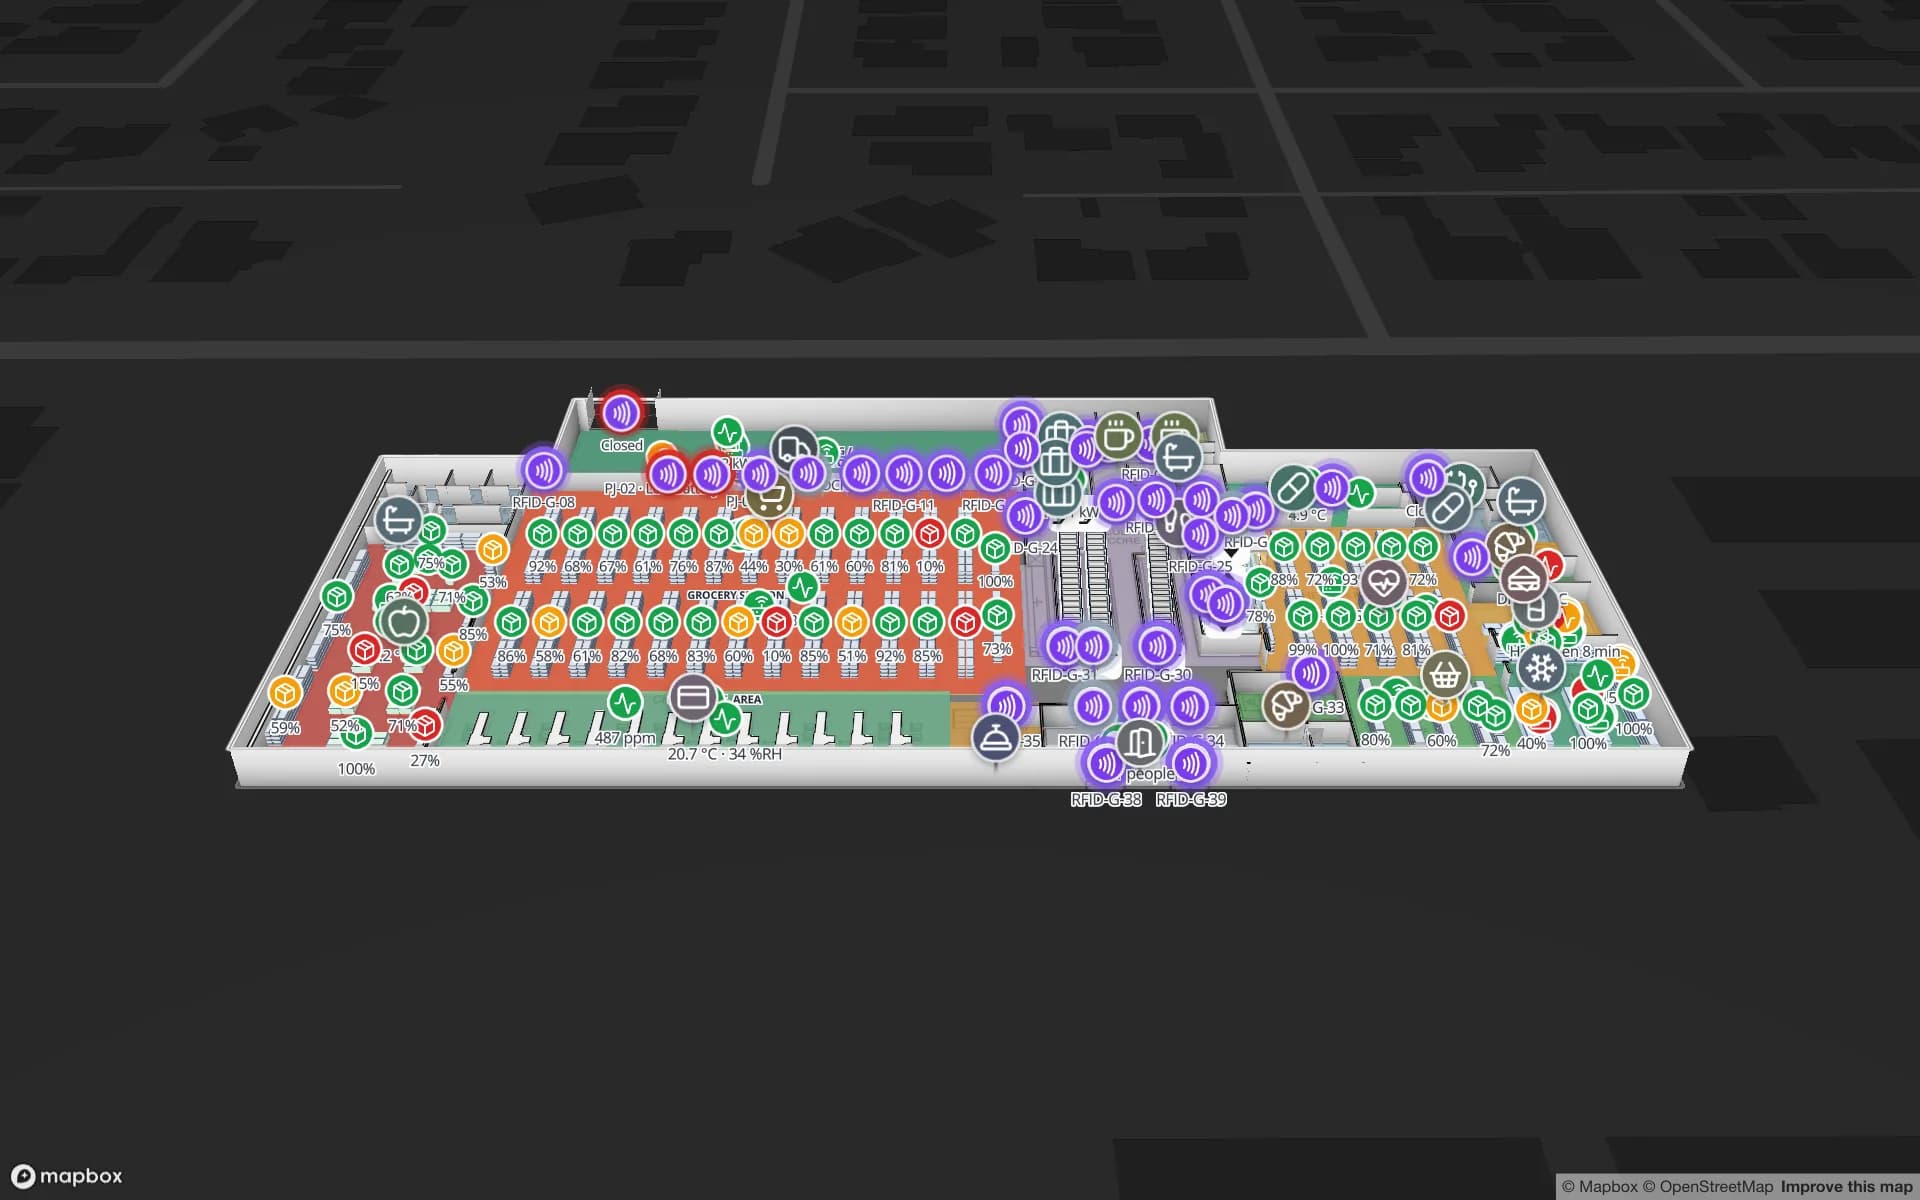
Polar Pharma — Cold Storage & QC Facility, a pharmaceutical cold store & qc lab demo, in the Spatial Map 3D viewer with live device markers
Polar Pharma — Cold Storage & QC Facility
Polar Pharma, a demo pharmaceutical cold store: temperature zones tinted from probes, cold-room doors, reefer docks, quarantine and 1,140 rack locations on two floors.
Rack locations in the Polar Pharma cold-store demo
1,140
Tables behind the Polar Pharma demo, from probes to door events
24
How often alert rules are checked, with alerts shown in the app
15 s
Free trial, up to 5 facilities, no card
7 days

Genome Valley and a state that makes medicines

Business Today, in February 2026, described Genome Valley as roughly 2,000 acres on Hyderabad’s outskirts with over 200 biotech and pharma companies, and reported that Telangana accounts for about one-third of India’s pharmaceutical production and nearly one-fifth of its pharma exports (a figure the article states without naming a source). At BioAsia 2024 the state announced a next phase of the valley on 300 acres with Rs 2,000 crore of investment. New plants mean new buildings, and a new building starts with drawings nobody has yet used for monitoring.

Upload the architect’s PDF or DWG, align it, draw each cold room, ante-room and store as an area, and a sensor table decides how each one is coloured. Spatial Map is the display and the alert layer, not a sensor company and not a validated monitoring system. The Polar Pharma demo shows the pattern with 24 tables behind it: probes, excursions, door events, reefer shipments and QC samples.


Cold rooms, quarantine and controlled ambient

A pharmaceutical store usually has three kinds of space: cold or frozen rooms, controlled-ambient storage and a quarantine area, each with its own limits. You set the limits in the rule, not Spatial Map: a rule that matches a probe above its limit for N minutes raises an alert, another that fires when a probe has not reported for N minutes catches a dead sensor, and both are checked every 15 seconds with in-app alerts you can acknowledge and resolve.

Door sensors on the same plan show which room is open, so a rising line on a probe can be read next to the door that caused it. Quarantine and returns areas are drawn the same way, with stock on hold marked in place. Spatial Map makes no GMP or other compliance claim: your quality system stays the record, and alerts here are in-app only (bell, pop-up and the Alerts page), not email, SMS or push. The post on pharma cold storage and QC monitoring describes the layout, and sensor alert rules shows how to build the rules.

The airport’s pharma cargo zone, and what is yours

Rajiv Gandhi International Airport commissioned a second cargo terminal on 18 May 2026: 16,864 square metres, about 50,000 tonnes a year at first and room to reach 100,000, with what its operator describes as a large, fully temperature-controlled pharmaceutical zone and continuous monitoring. Trade press reports that the airport has had an airport-based pharma handling facility since 2010, the first in India.

None of that is data you see in Spatial Map, and we do not connect to the airport’s or any airline’s systems. Your part of the chain is the last mile before it: the reefer dock, the staging area and the quarantine rack where a consignment waits to be released. Polar Pharma maps reefer docks and shipments at their doors for exactly that handover, and a table fed from your own logger or dispatch system keeps the map current.

Forty degrees: when the shed itself is the problem

IMD treats a maximum of 40 °C as the heat-wave threshold for plains stations, and Telangana Today reported Hyderabad around 40 °C in May 2026 with forecasts of up to 43 °C later that month. Ambient warehouses, loading bays and un-cooled dispatch halls are where ordinary stock, labels and packaging take that heat, and where one end of a long shed is always hotter than the other.

A heatmap of the temperature table, drawn on the plan, shows which bay peaks at mid-afternoon; heat stops at walls and closed doors, and the layer is hidden behind walls when the map is tilted. The cold storage heatmap post shows an example, and the temperature monitoring page covers the general case.

Services for teams in Hyderabad

Hyderabad teams tend to start with one of these:

  • Pharma and biotech sites start with temperature monitoring and IoT sensors, mapping the rooms they already have probes in before adding any new ones.
  • Distribution warehouses begin with a heatmap of an ambient shed, then add inventory tracking by bin.
  • Teams that move pallets between rooms and docks add asset tracking for carts, loggers and reusable shippers.
  • Probes, loggers and gateways come from your monitoring vendor. Our team can source RFID and BLE tags and gateways on request, quoted per project, with warranty and device support from the manufacturer: see hardware and demo kits on request.
  • Where your IT team is busy, we build integrations that read your logger platform or WMS, and other custom software, as client projects. Run it as cloud or on-premises.

Also served nearby

The same approach covers Jeedimetla, Patancheru and Medchal, the industrial areas on the city’s edge, and sites a little further out in Rangareddy and Sangareddy districts. Nothing needs to be installed at any of them: the map opens in a browser.

How Spatial Map does it

From a cold room to a coloured area

  1. 01

    Pick the rooms that matter

    The cold room, the freezer and the quarantine area first; ambient storage after.

  2. 02

    Draw them and name the probes

    Import the plan, draw each room as an area, and use the probe IDs your logger platform uses as the table key.

  3. 03

    Connect the readings

    Your logger platform or integrator posts rows through the write API, or Spatial Map polls a REST endpoint; CSV upload works for a first test.

  4. 04

    Write the rules

    In-app alerts for a reading over its limit for N minutes, a probe silent for N minutes and a door open too long.

Where Hyderabad teams monitor temperature

Cold and frozen rooms

Zones tinted from live probes, with door events and excursions on the same plan.

Ambient warehouses in a hot summer

Temperature and humidity coloured by bay, with a heatmap of the worst hours.

Reefer docks and handover

Reefer shipments at their doors and a silent-probe alert for trailers on the yard.

Store chillers and fridges

Fridge temperatures on every floor of a retail building, with alerts per cabinet.

See it on real demo facilities

Fictional names, real floor plans, live sensors, RFID, BLE tags and gateways — open any of them in the browser.

All 13 demo facilities

Temperature monitoring in Hyderabad — questions we get

No, and we make no GMP or other compliance claim. It displays readings your sensors and loggers send and raises in-app alerts from rules you write. Keep your validated monitoring and quality records where they are; use the map to see where an excursion is and what is nearby.

Any system that can send a probe ID, a value and a time. Your vendor’s platform or integrator posts rows through the write API, or Spatial Map polls a REST endpoint; CSV and Excel upload work too. We do not make probes, and the only built-in device driver is for a BlueIOT RTLS server.

Not from us. Alerts here are in-app only: a bell, a pop-up and the Alerts page, with acknowledge and resolve. If a night-shift page or SMS is essential, keep it in your monitoring platform and use Spatial Map for the map and the review.

No. Spatial Map does not connect to airport, airline or forwarder systems. It maps the buildings you own or lease, from your own data, and you can share a read-only link with a partner if you choose.

You do. Spatial Map ships no preset ranges: you write each rule with your own limit and duration, so it follows whatever your product, SOP or customer specifies.

No. Spatial Map is sold online and our team works with customers in India remotely, by video call and through the contact form. There are no local resellers or partners.

In US dollars, the same worldwide: a 7-day free trial for up to 5 facilities with no card, then Pro at $60 a month or $600 a year for up to 4 facilities. Larger estates are quoted as custom services.

Colour one cold room on a live map.

Start the free trial and open the Polar Pharma demo, or send us a room plan and a sample of probe readings through the contact form.