Features · Reports & dashboards

Facility reports and dashboards, with the live map inside

Spatial Map builds facility reports and dashboards from the same live data as the map: a set of built-in reports for every facility, a step-by-step report builder for your own, and widgets from KPIs and charts to a live facility map & list. Export to PDF, Excel, CSV or JSON, or share a read-only public link — no BI tool in between.

Last updated:

No credit card. Runs in the browser. Pro is $60/month for up to 4 facilities. Book a demo

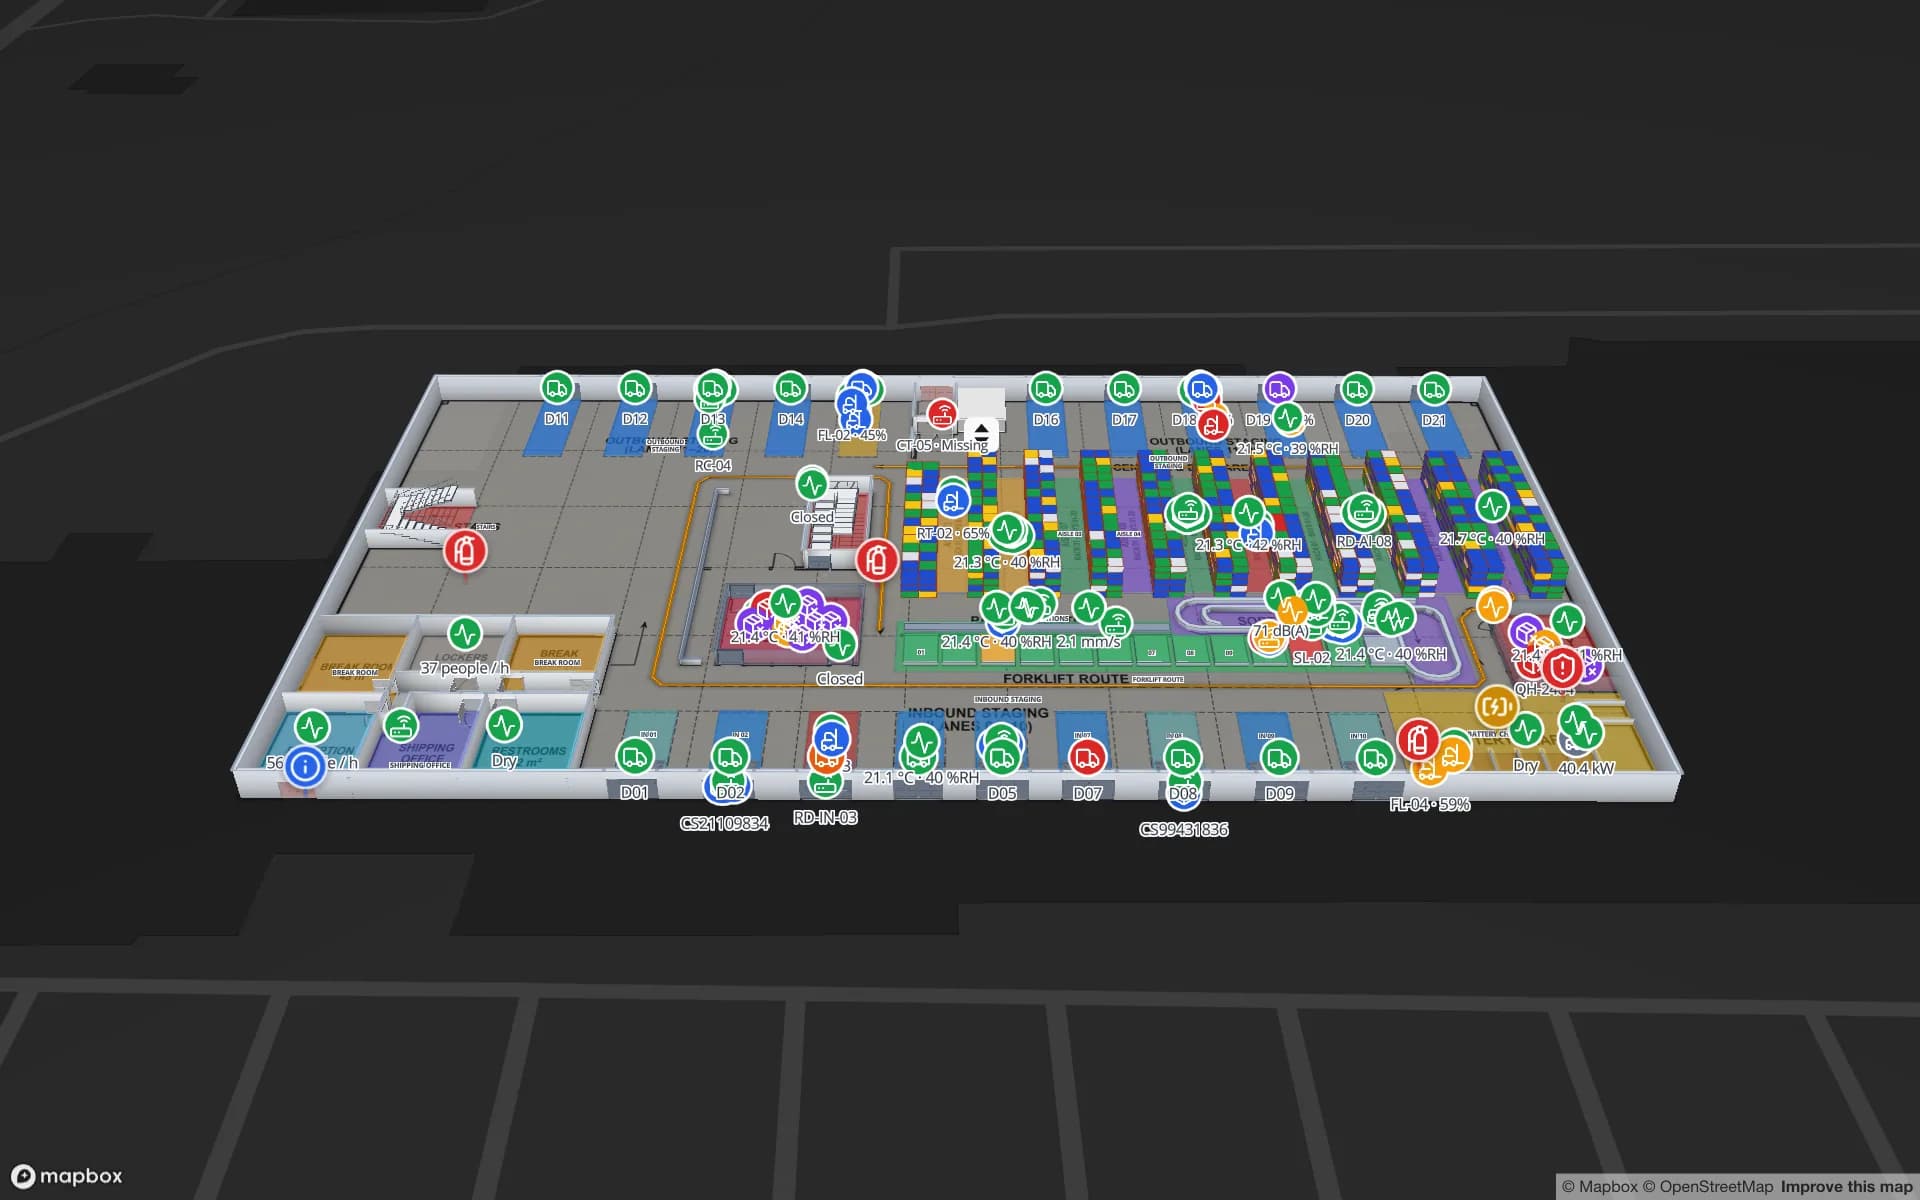
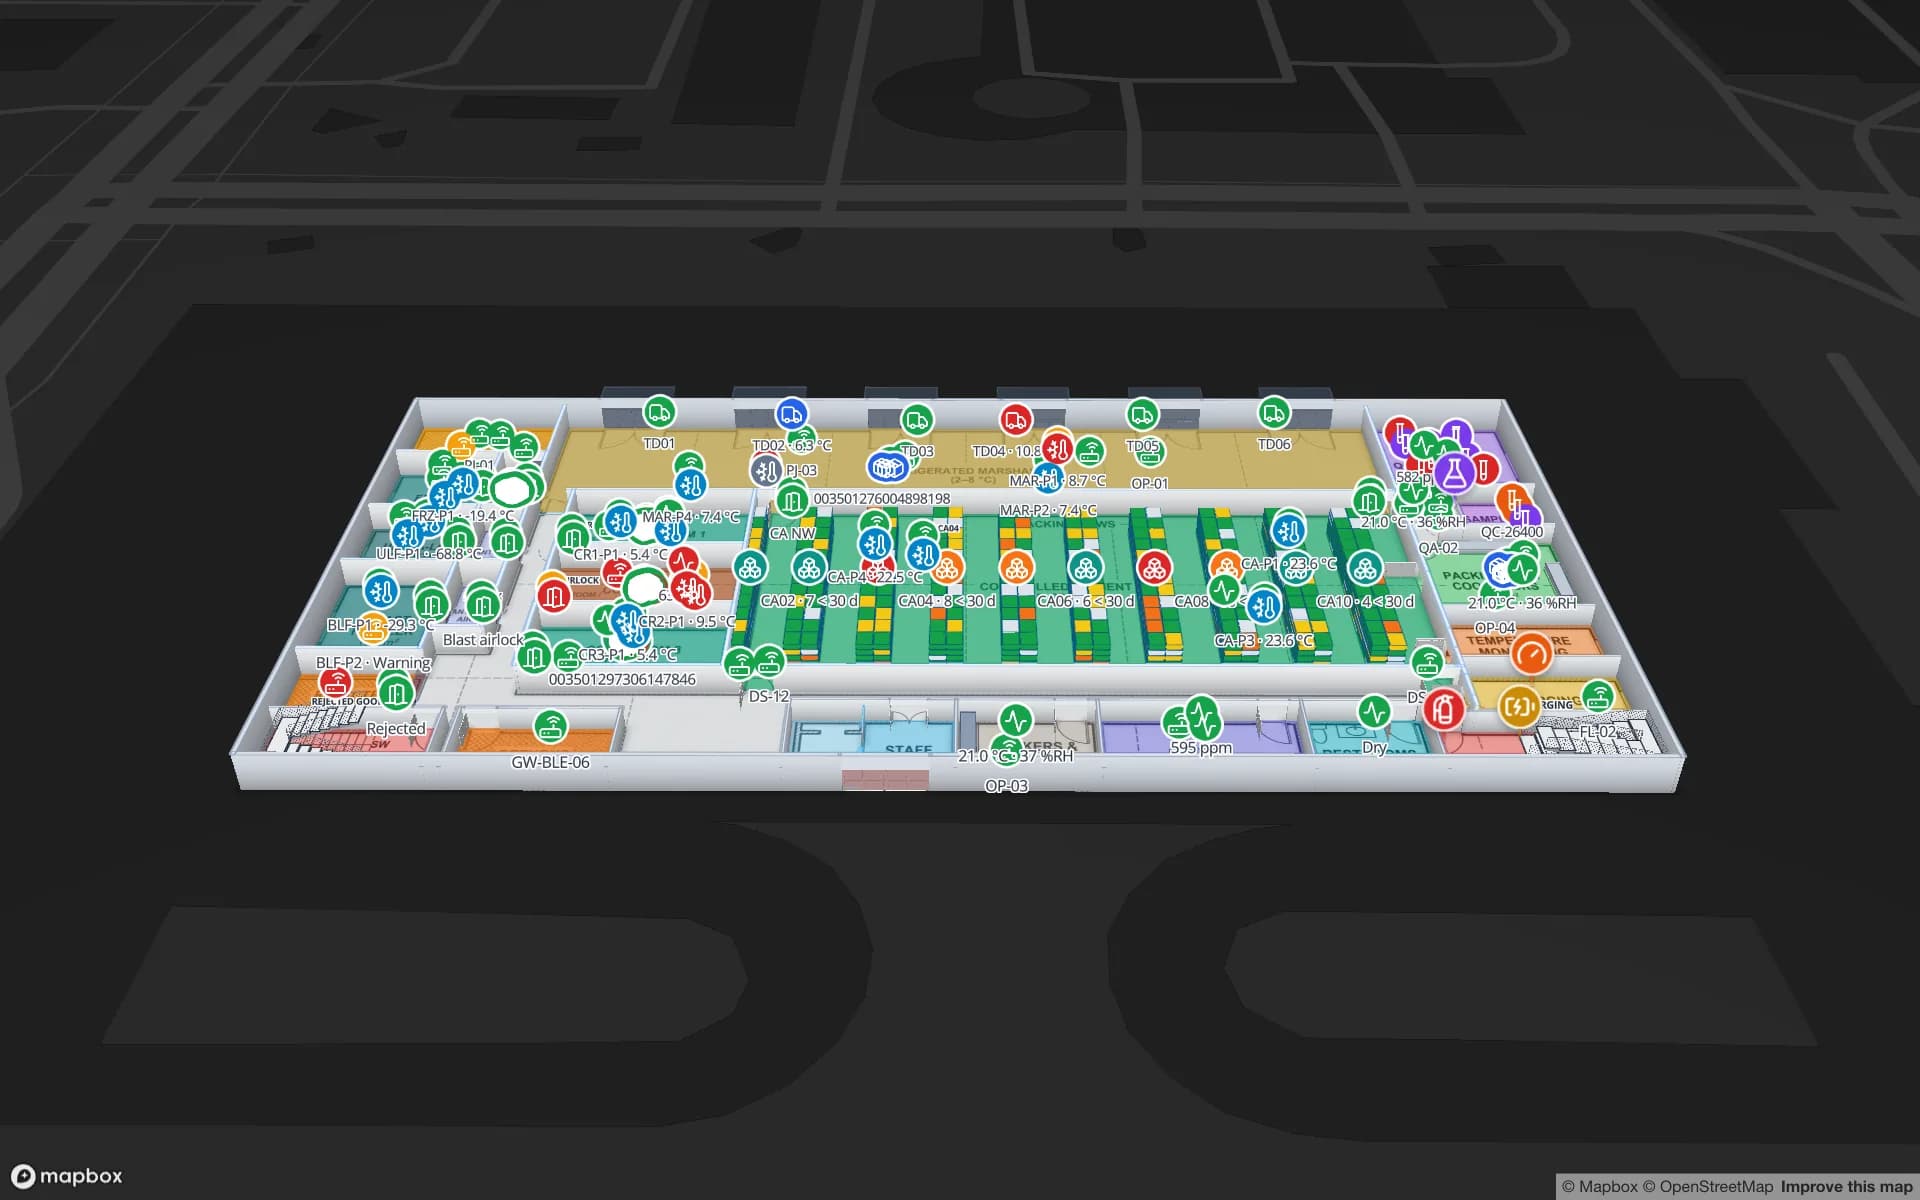
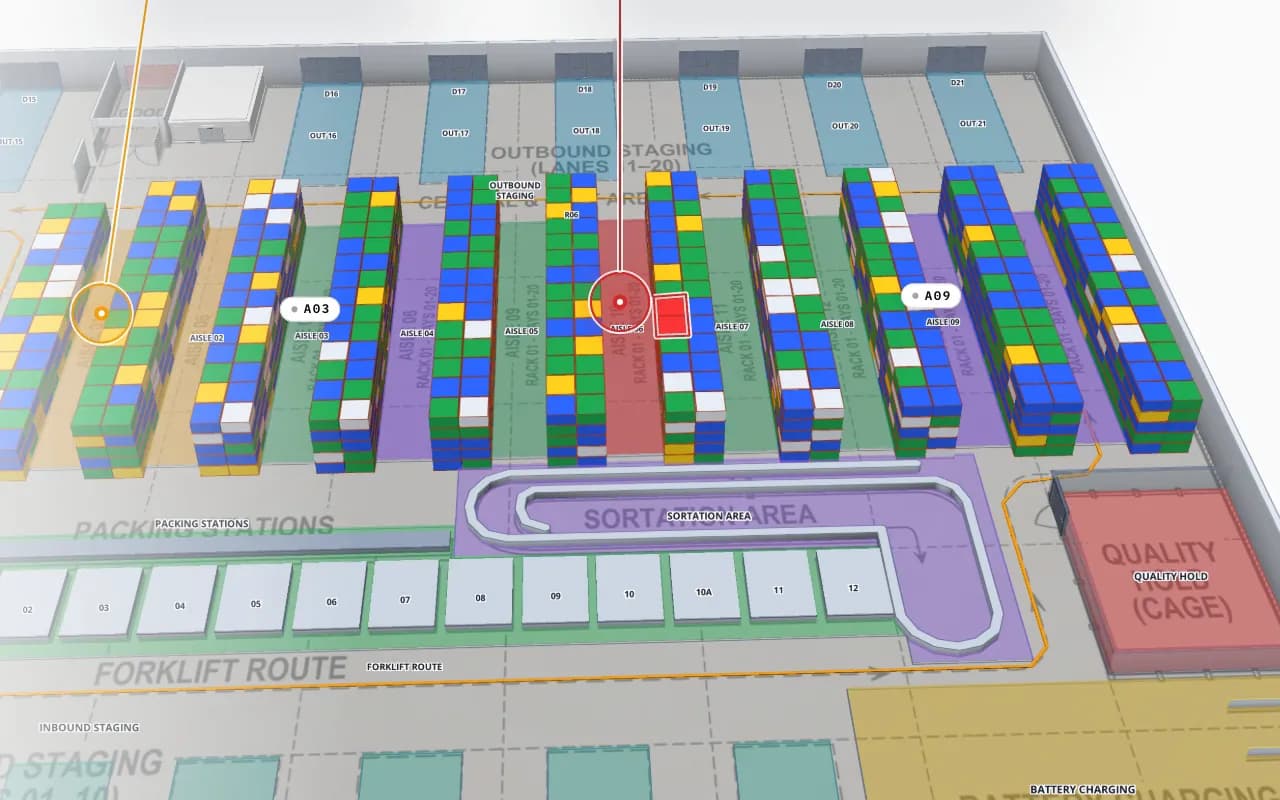
Crestline Fulfillment Center in 3D with every rack location coloured full, OK, low, empty or blocked, and a blocked location highlighted in red
Crestline Fulfillment Center
Crestline Fulfillment Center (demo): every rack location coloured by stock status — the map a stock report’s facility map & list is built around.
Built-in reports for every facility
8
Widget kinds, incl. the facility map & list
23
Export formats: PDF, Excel, CSV, JSON
4
Layouts: Document, Grid, Full map
3

Reports you get without building anything

Every facility gets eight built-in reports about what is drawn on its map — floors, areas, racks, markers, walls, doors, stairs, lifts and more — each with key numbers, charts, viewer filters and a facility map & list. Each table you link to the map gets its own linked-data report too: row count, totals of its number fields, a donut by status and a list of every row placed on the map.

They are ordinary reports: open, star, share, export, edit, rename, duplicate or archive them. In the facility set you can even fix an item from its detail panel — Edit, Save changes — without opening the editor.
The step-by-step report builder

The report builder is a wizard: pick a type — Detail (a table of records), Summary (grouped totals for charts and KPIs), Editable (records viewers can edit in place) or History (records over time) — then a data source, columns, filters, viewer filters, sort and limit, conditional formatting, parameters, extra queries, widgets, a layout and who may view or edit. Review & save names anything that would block the save or show empty.

Sources are your tables and integrations, plus the built-in facility sources that read the map itself.

Map, table and chart widgets

A report is a set of widgets, each reading one query. The 23 widget kinds include KPIs and big values with a delta, line, bar, area, pie and donut charts, scatter plots, heatmaps, data and editable tables, notes and alert banners — and the facility map & list, a list of records beside a live map of the facility: pick a row and its shape lights up; click a shape and its row is picked.

  • Document — widgets stack like a report; the default.
  • Grid — a 12-column dashboard you lay out by dragging and resizing.
  • Full map — the live 3D map fills the page, with the list, the picked record, key numbers and charts floating over it, refreshing every 10 seconds to 5 minutes. Built for operations screens; see full-map reports.
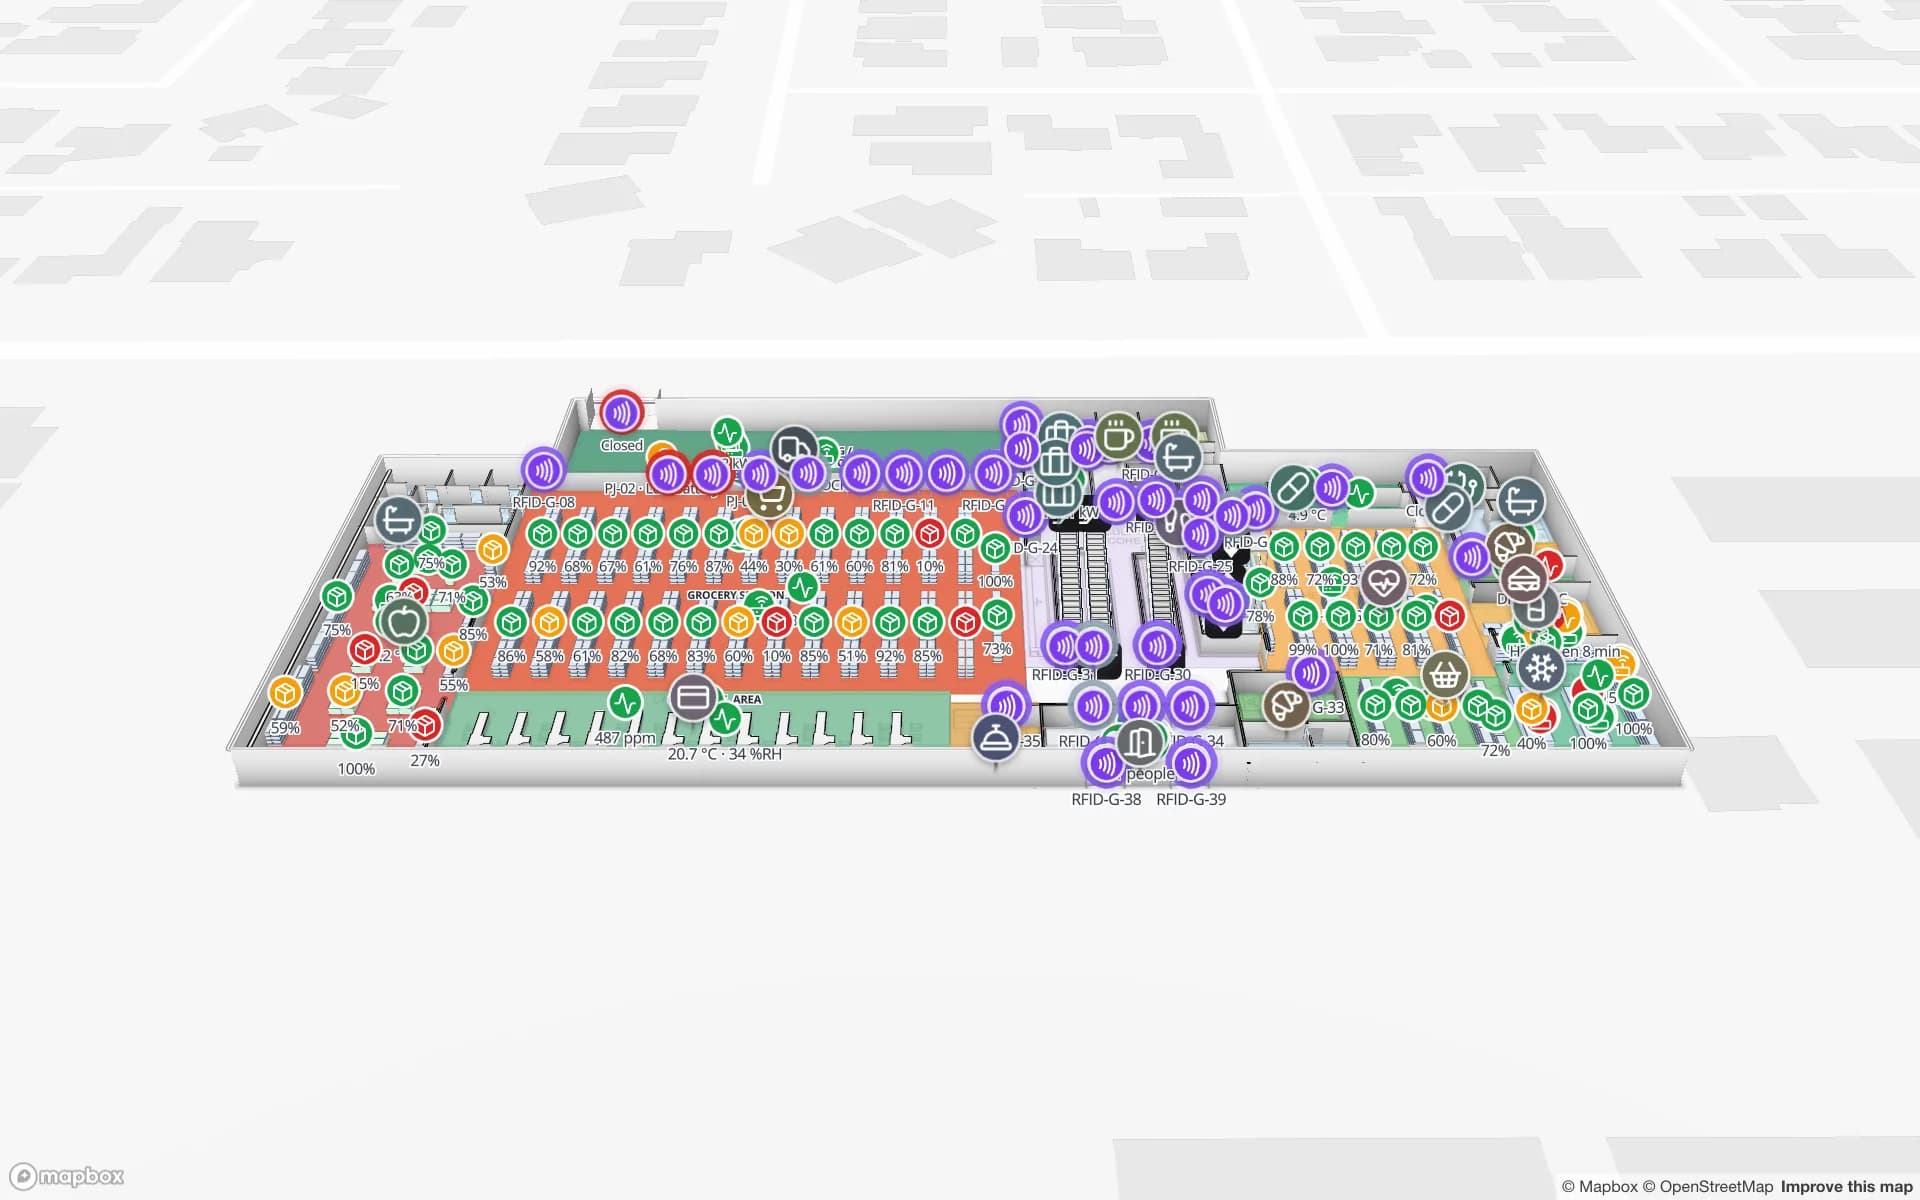
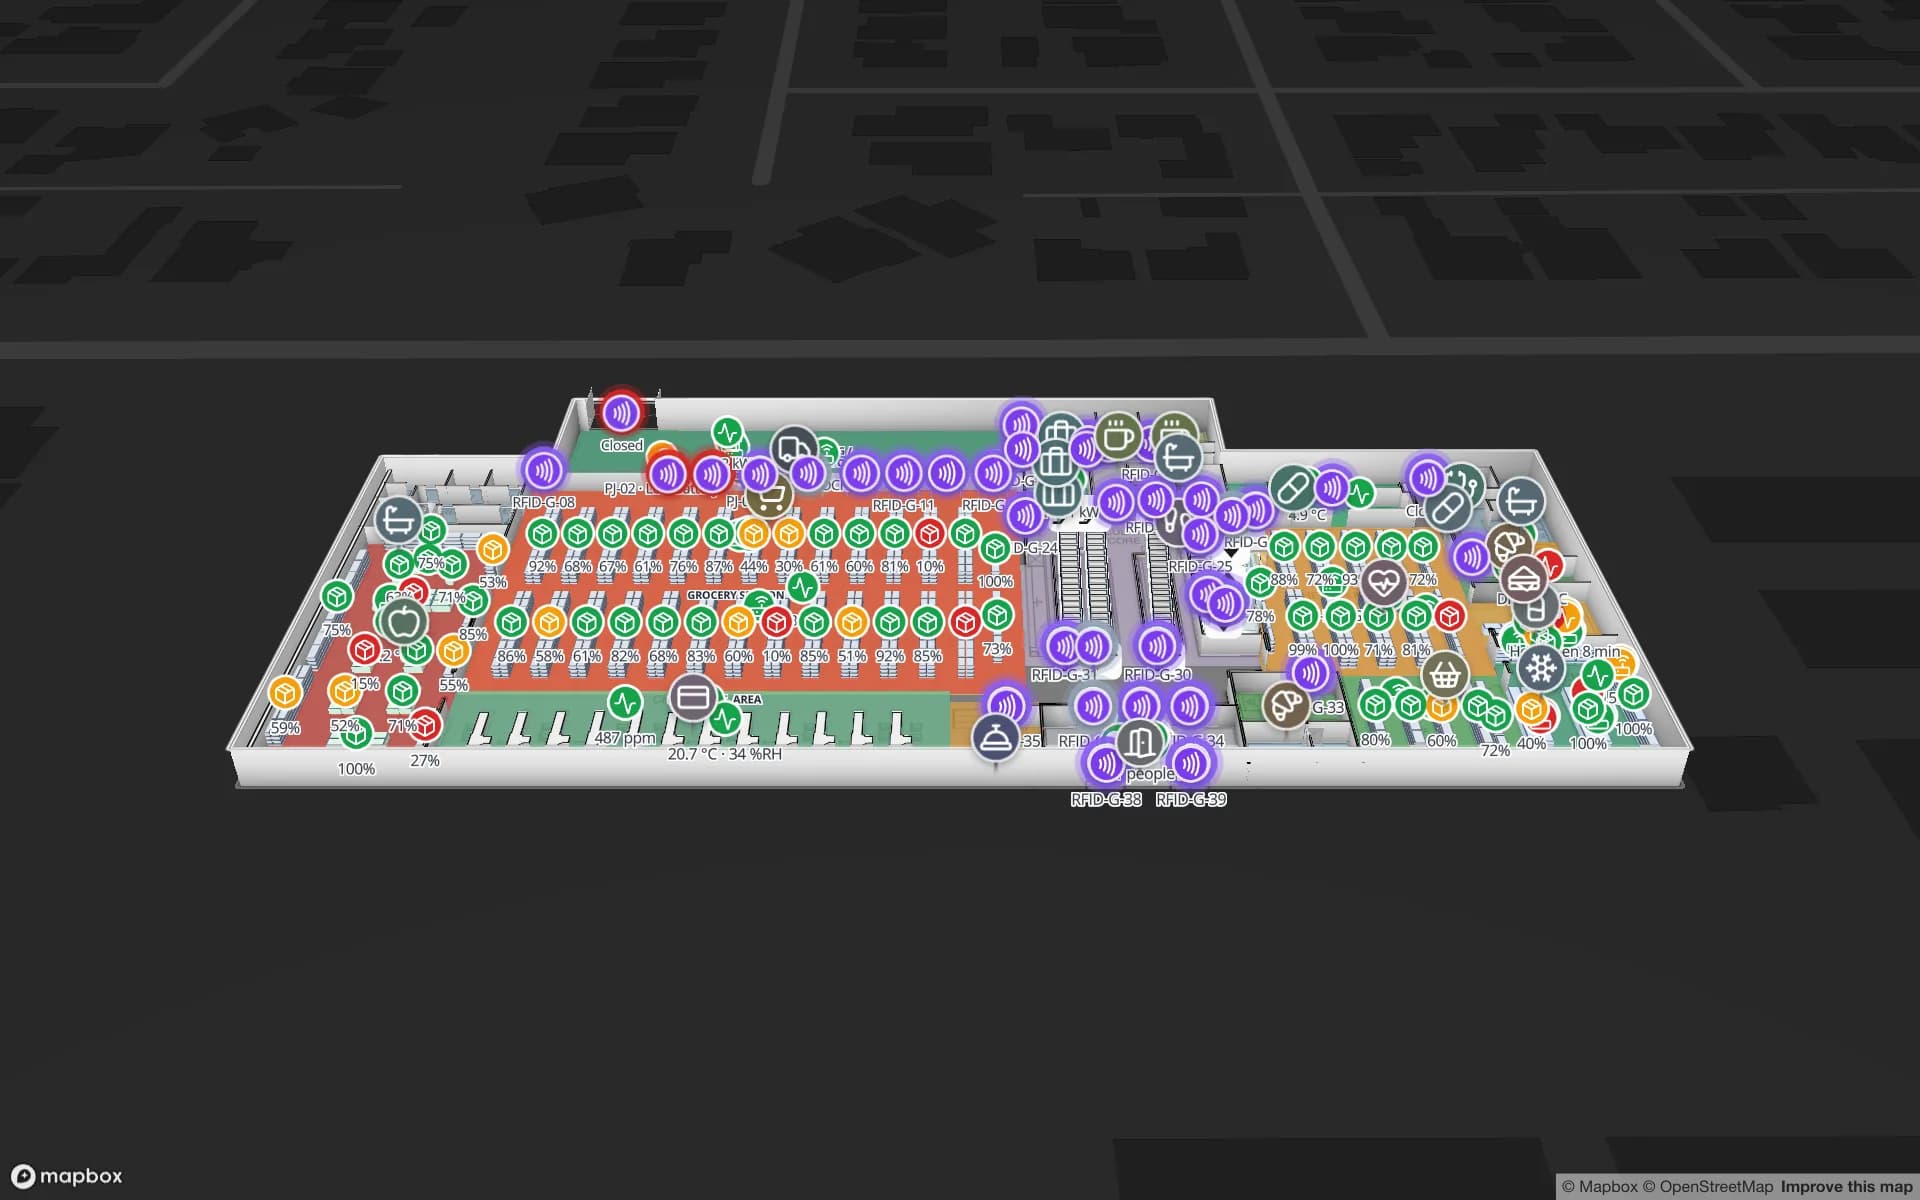
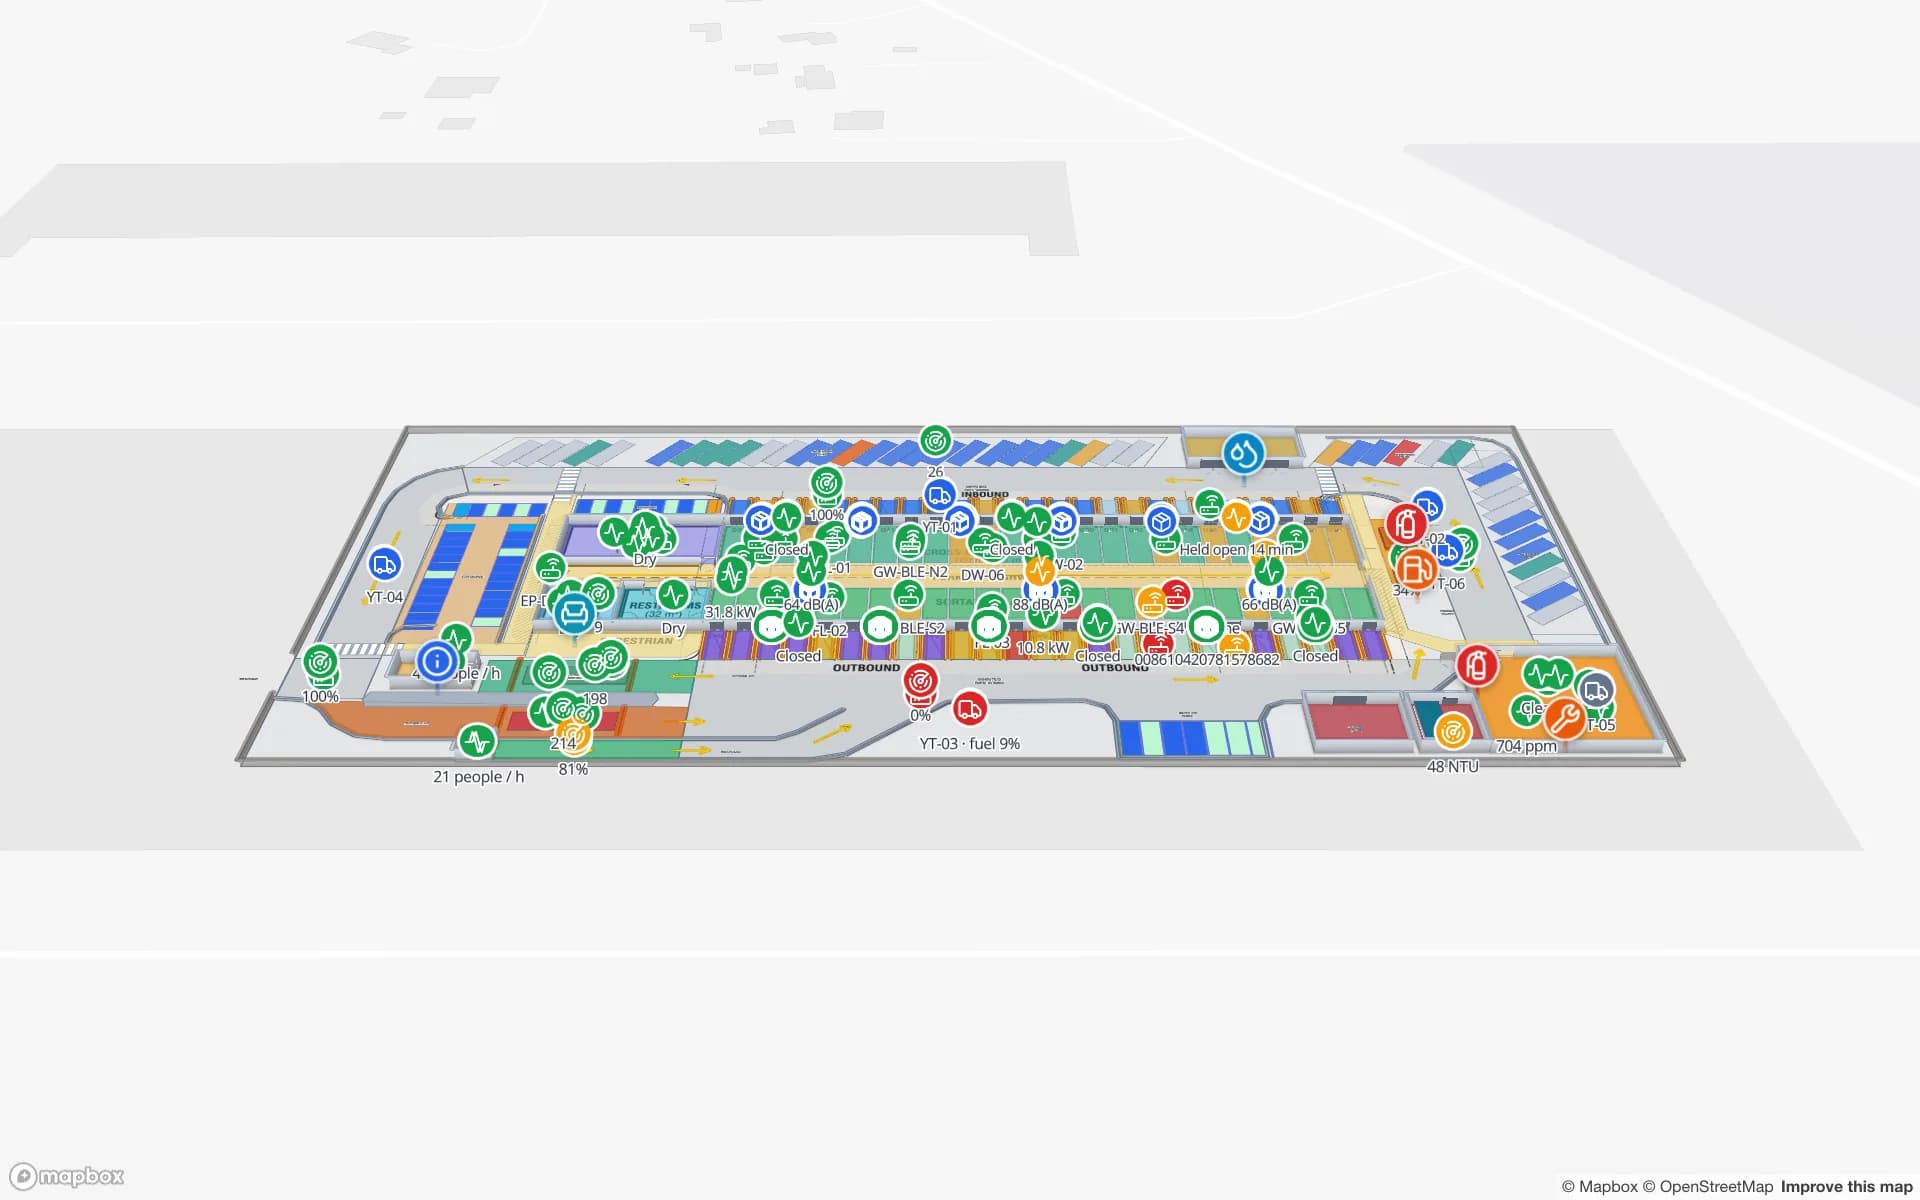
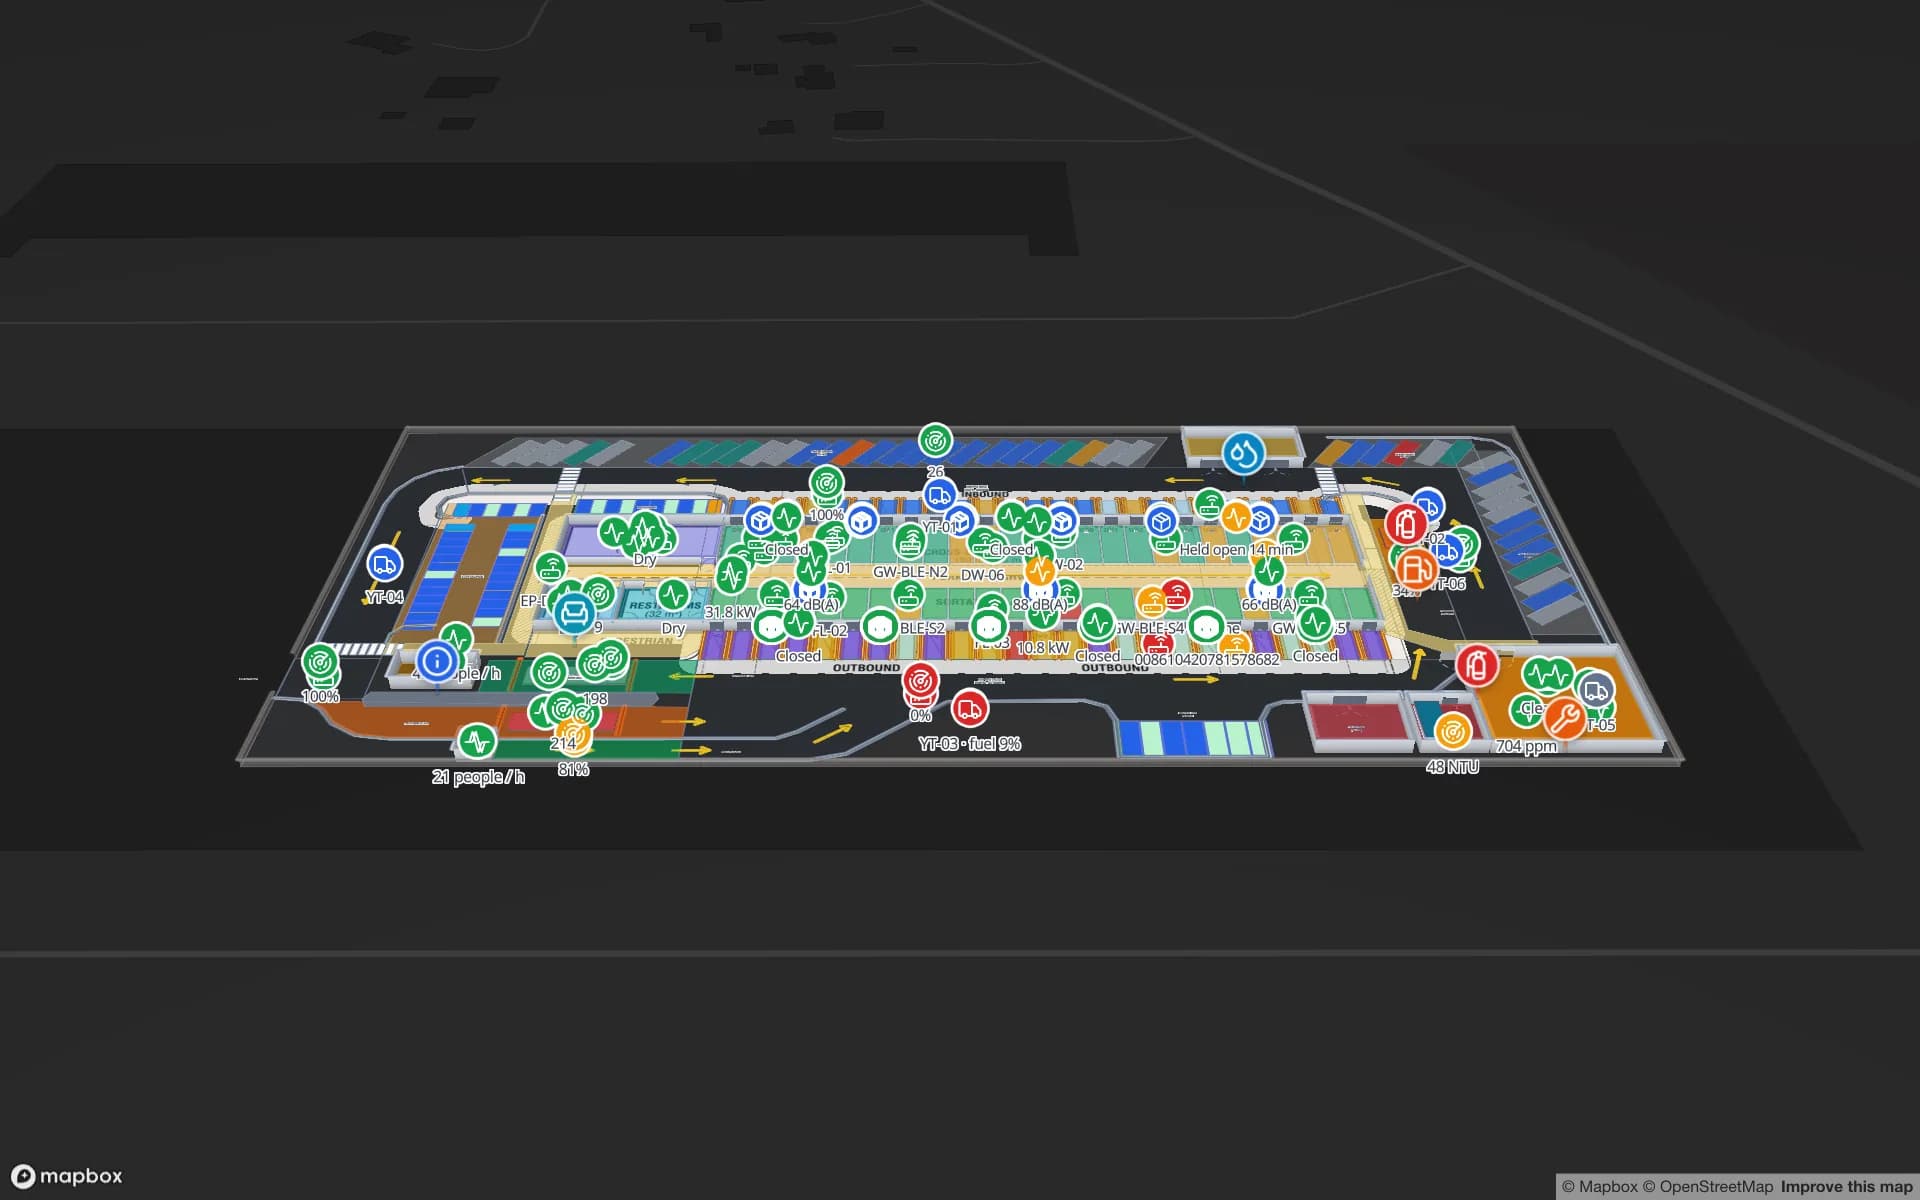
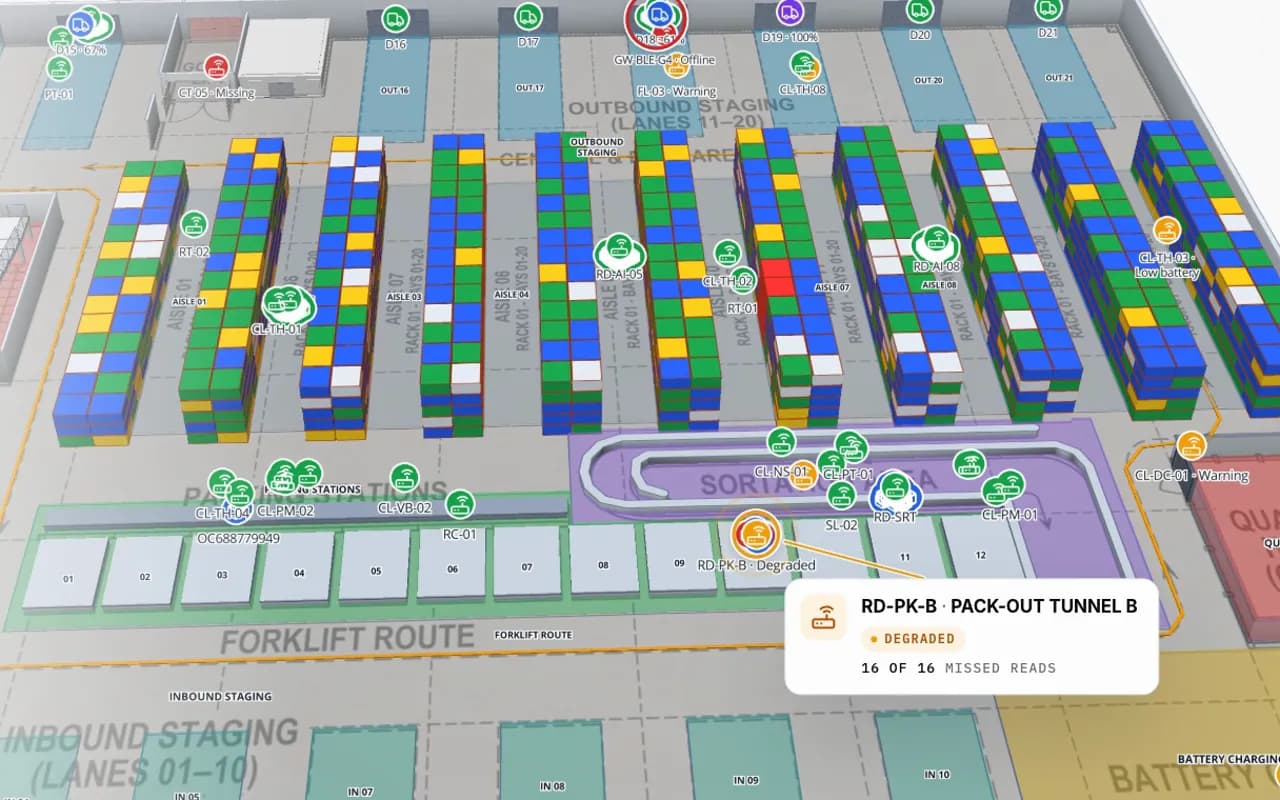
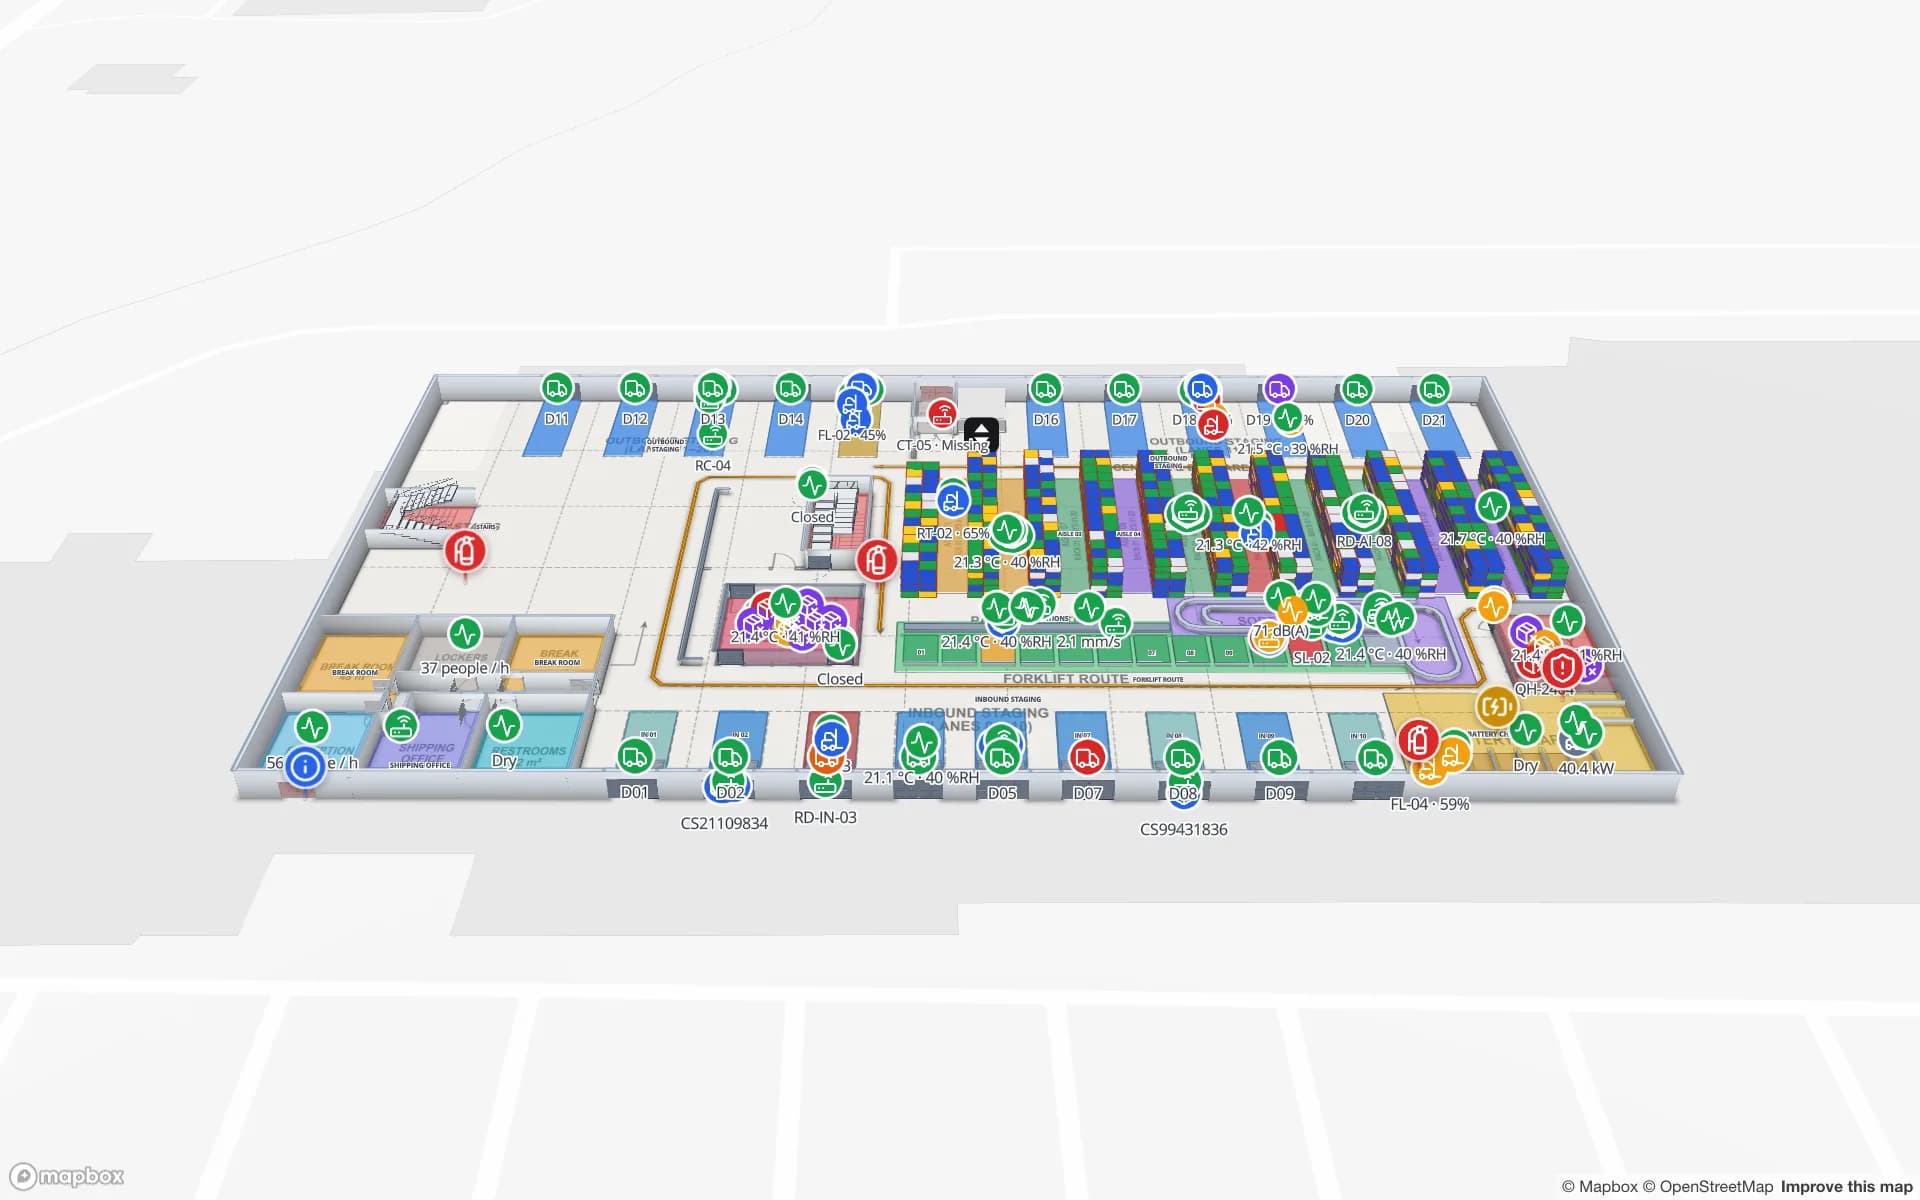
Crestline Fulfillment Center in 3D: racks coloured by stock status, RFID carton markers moving between readers and a pack-out tunnel reader showing missed reads
Crestline Fulfillment Center
Crestline Fulfillment Center (demo): RFID cartons moving between readers over racks coloured by stock — live data a full-map report shows.

Export to PDF, Excel, CSV and JSON

Click Export on a report, pick a format, tick the widgets to include and choose the rows — As on screen, with each table’s search, sort and hidden columns, or All loaded rows. Excel and CSV take formatted or raw values; PDF has paper size, orientation and greyscale options. Every widget’s ⋯ menu also exports just that widget, as PNG for charts and KPIs, or copies its rows for a spreadsheet.

A whole report can also be downloaded as a JSON spec and imported into another workspace.

Share with members and with anyone

Inside the workspace, Access gives each member None, View or Edit, and a copied link opens with the filters set now. For people outside it, report editors create public links: a read-only page with the report’s widgets, live map, layers and history player, no sign-in, and nothing else in the workspace shared. Each link can have a label, an expiry and a view cap, and can be revoked.

Reports are opened, exported or shared by people; scheduled or emailed reports are not part of the product today. A custom project can add them.

What each export format carries

FormatTakesOptions
PDFEvery widget except dividers, plain maps and the facility map & listA4 or Letter, orientation, colour or greyscale, filters and timestamp
ExcelTables, charts, KPIs and heatmapsFormatted or raw values, header colour, conditional colours, freeze, autofilter
CSVTables, charts and heatmapsFormatted or raw values, separator, header, BOM
JSONTables, charts, KPIs and heatmaps, plus text, notes and alertsObjects or arrays, displayed text, pretty-printed
PNG (one widget)A chart or KPIFrom the widget’s ⋯ menu
How Spatial Map does it

A report of your own in four steps

  1. 01

    Start from what you have

    Open a built-in report and click Edit, or click New report on the Reports screen.

  2. 02

    Pick the type and source

    Detail, Summary, Editable or History, over a table, an integration or the facility itself.

  3. 03

    Add widgets and a layout

    KPIs, charts, tables and a facility map & list, in a Document, Grid or Full map layout.

  4. 04

    Save, share and export

    Set access, save, then share a link or export to PDF, Excel, CSV or JSON.

Reports in the demo workspace

Warehouse KPIs

Stock by rack status, dock turns and pallets by lane beside the live rack map.

RFID live map

A full-map report of store RFID readers: status, reads today and offline readers in red.

Cold-chain review

Probe readings, excursions and door events, exported to PDF for the quality file.

See it on real demo facilities

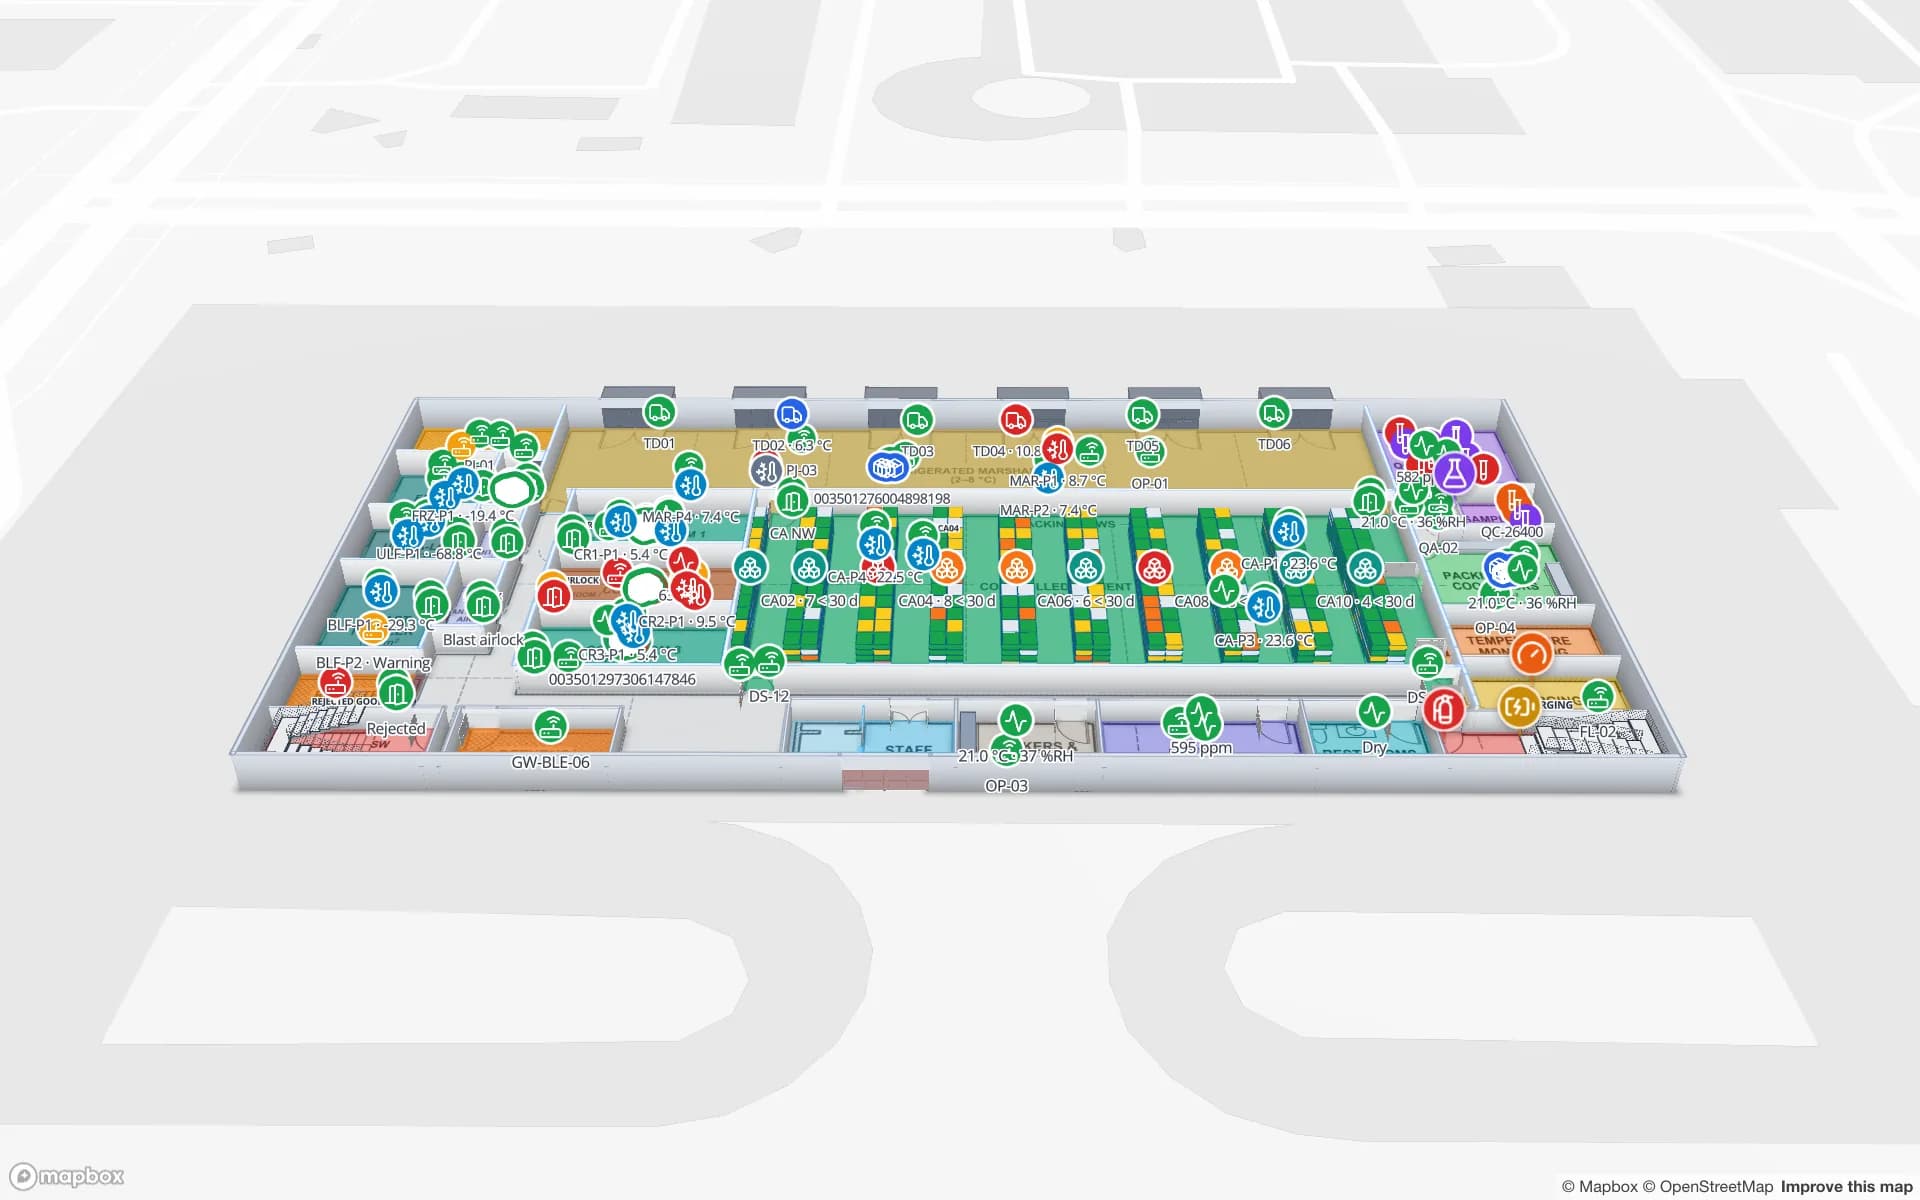
Fictional names, real floor plans, live sensors, RFID, BLE tags and gateways — open any of them in the browser.

All 13 demo facilities

Facility reports and dashboards — frequently asked questions

No. Every Spatial Map facility gets eight built-in reports about what is drawn on its map, and each table linked to the map gets a linked-data report. You can use them as they are or edit them in the report builder.

A report exports to PDF, Excel, CSV and JSON, with a choice of widgets and rows. A single widget can also be exported on its own, including as a PNG for charts and KPIs, or copied for a spreadsheet.

Yes. Report editors can create a public link: a read-only page with the report’s widgets, live map and layers, no sign-in needed. Each link can have an expiry and a view cap and can be revoked.

Yes. The facility map & list widget puts a live map beside a list of records, and the Full map layout makes the 3D map fill the page with the report floating over it.

Not today. Reports are opened, exported or shared by link. Scheduled delivery by email can be built as a custom project.

In an Editable report, yes — one row or many in one form, for the columns the author allows. Members with the Viewer role can only ever view; editing needs edit access to the report.

A 7-day free trial covers up to 5 facilities with no credit card. Pro is $60 a month or $600 a year for up to 4 facilities. Mapping, integrations and custom features are quoted as custom services.

Turn your facility data into reports people use.

Start a free trial and open a demo facility’s built-in reports, or send us your data and we will build the dashboards for you.