
Occupancy heatmap: from people counts to a floor plan
Build an occupancy heatmap on a floor plan: which sensors count people, how to keep it private, and how to turn room counts into heat that stops at walls.
What an occupancy heatmap shows
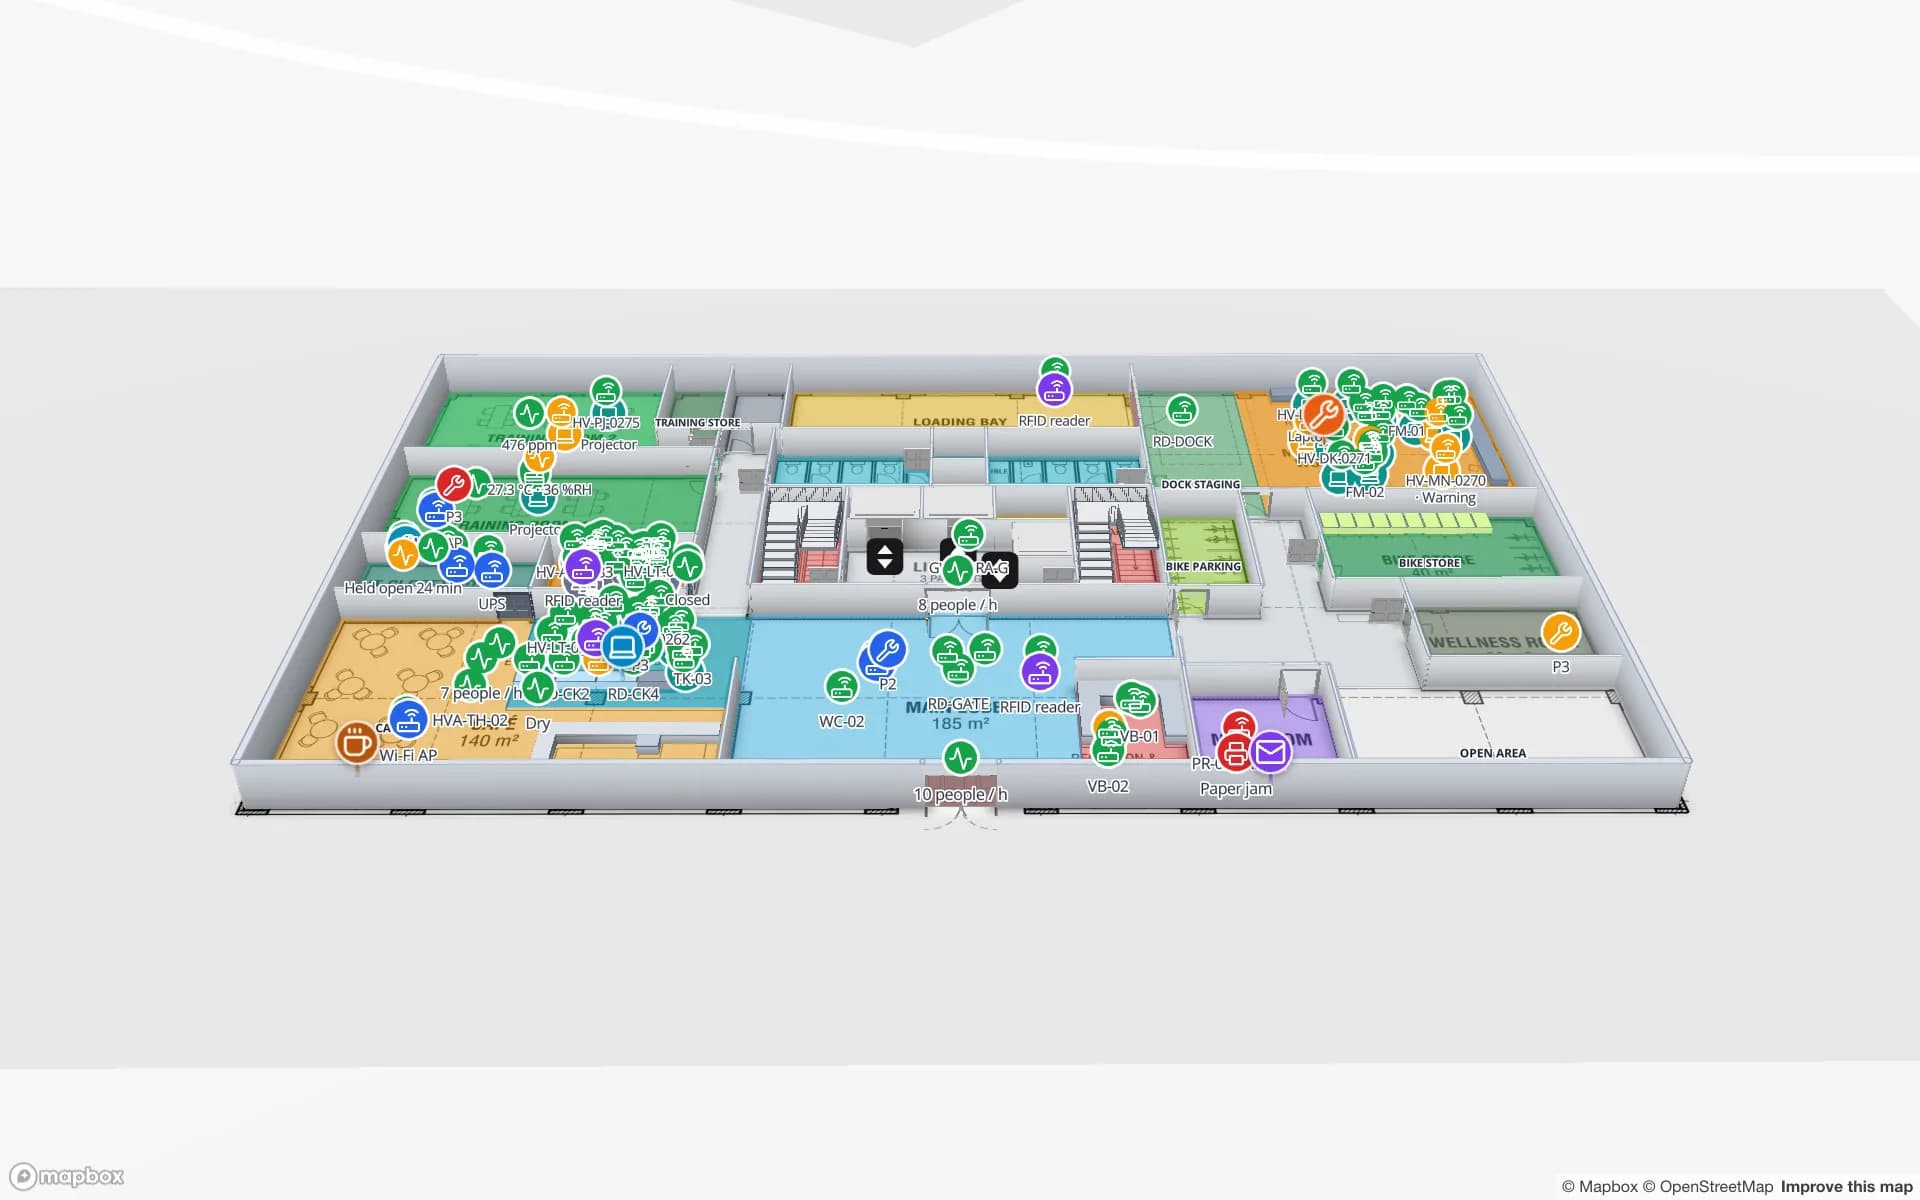
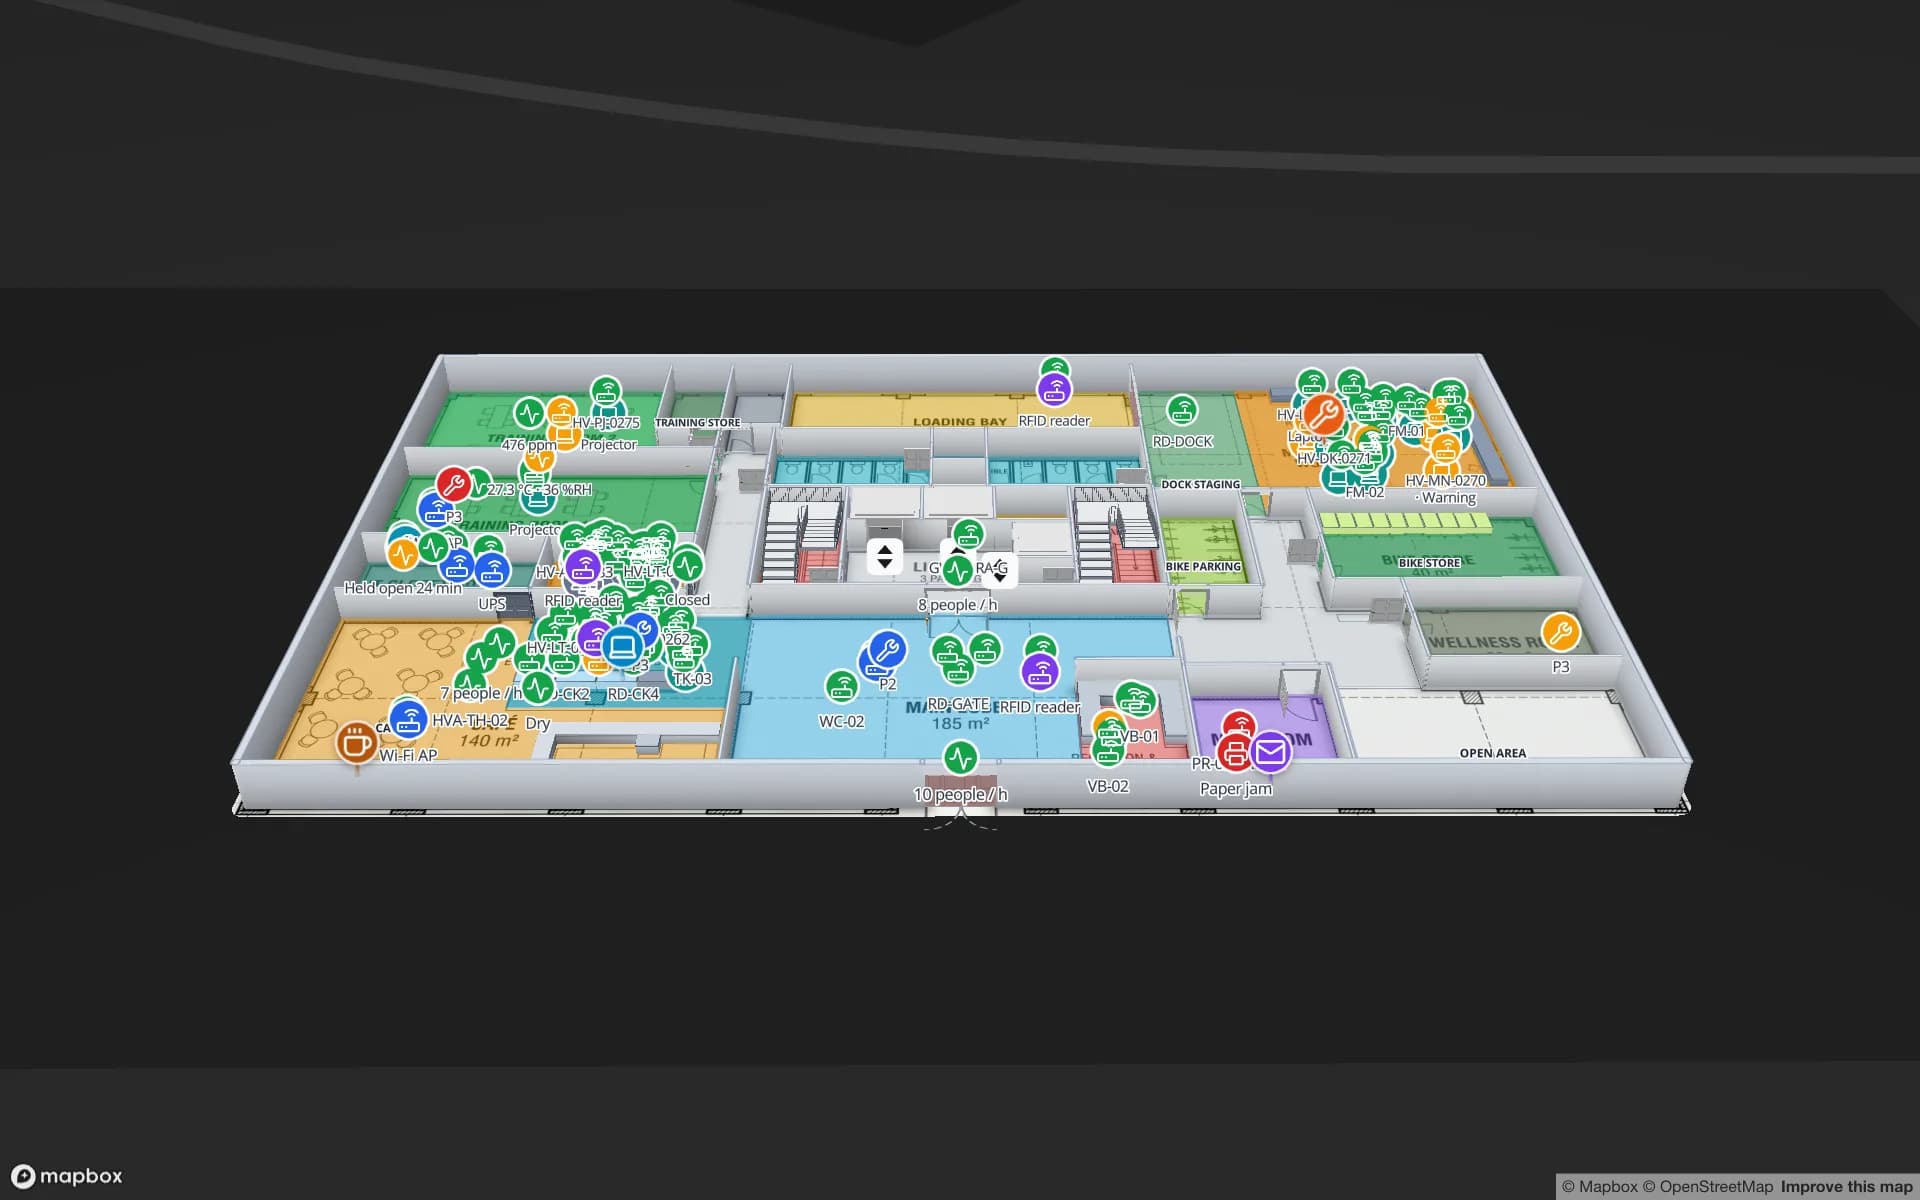
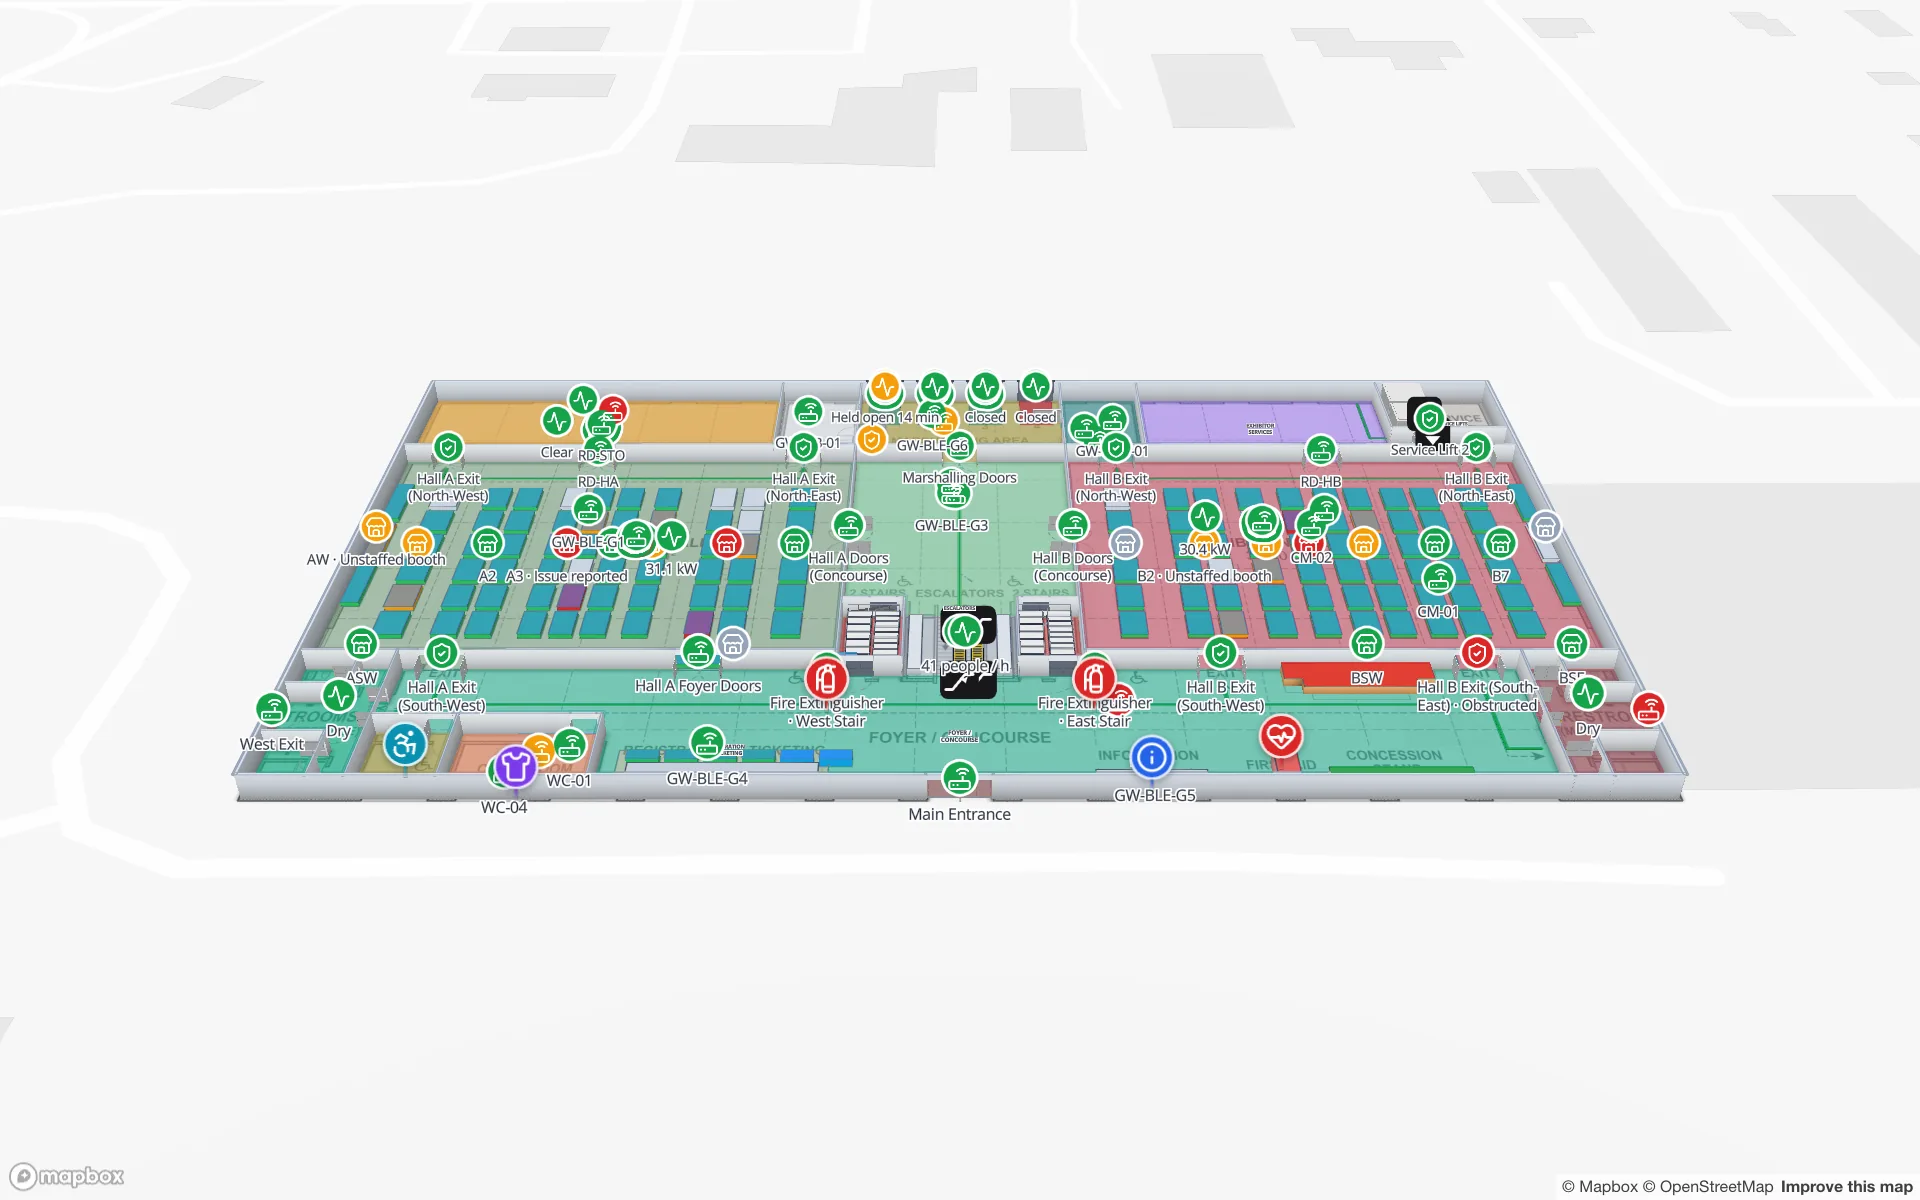
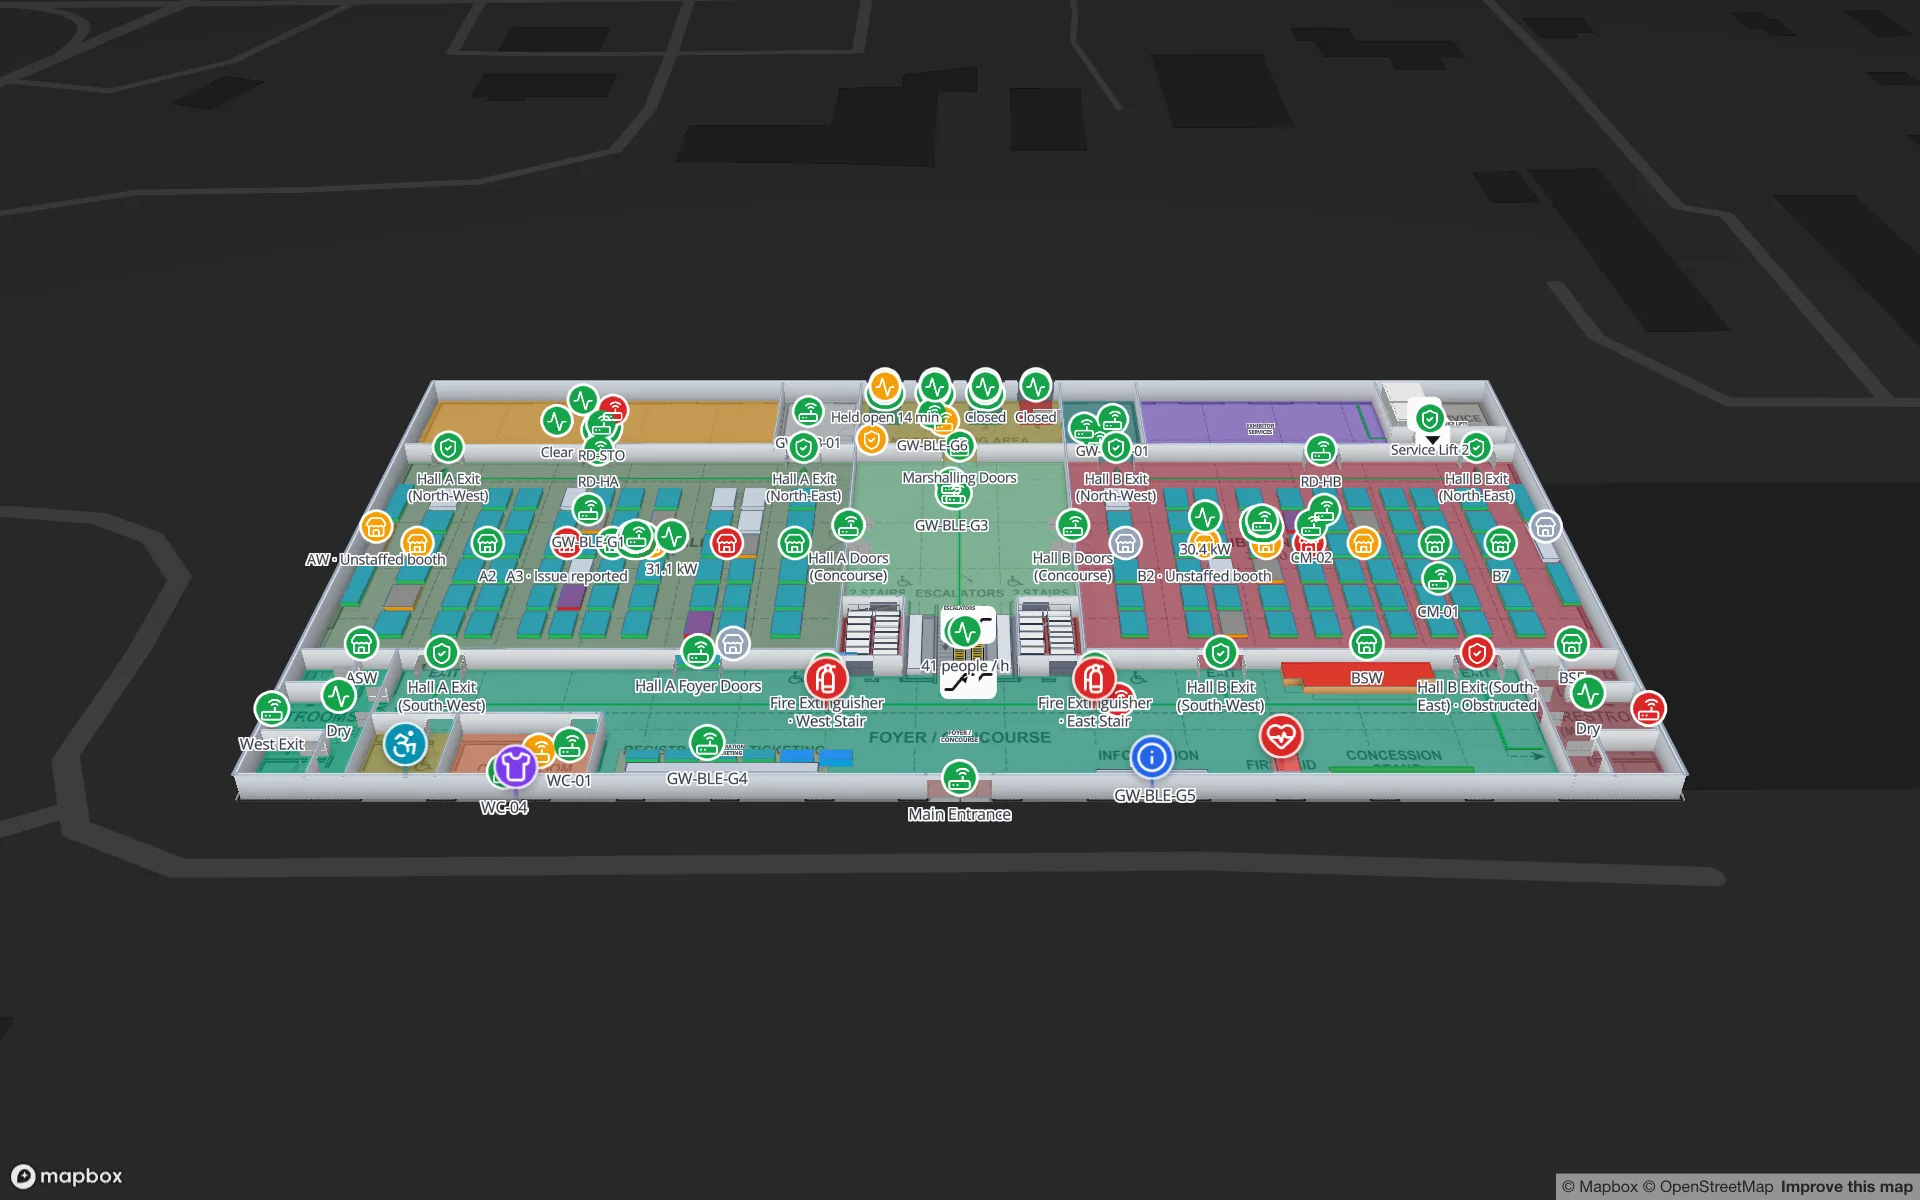
Spatial Map is a live indoor map that can turn people counts from your sensors into an occupancy heatmap on the building’s own floor plan, one floor at a time. An occupancy heatmap answers “where are people, and how many?” — which rooms, desks, halls or zones are used, when, and how full they get against their capacity.
Three words get mixed up. Occupancy is how many people are in a space at a moment. Utilisation is occupancy over time against capacity — a 12-seat room used by two people all day is busy but under-used. Footfall is how many people pass through. Offices care most about utilisation, venues about peak occupancy, shops about footfall (covered in retail footfall heatmaps).
Which sensors produce occupancy data
| Sensor | What it reports | Good for | Watch out for |
|---|---|---|---|
| PIR motion | Movement yes/no | Is a room or desk in use at all | Misses people sitting still; cannot count |
| Desk sensors (under-desk PIR or thermal) | Occupied / free per desk | Hot-desking, desk utilisation | One per desk, and batteries to change; a person who steps away reads as free |
| People counters at doors (beam, overhead stereo or time-of-flight, thermal) | In and out counts | Room, hall or floor occupancy by subtraction | Counts drift over a day; reset at night |
| Overhead area sensors (thermal arrays, time-of-flight) | Number of people in a zone | Meeting rooms, zones in open plan | Coverage per sensor; mounting height |
| Camera analytics | Counts, sometimes positions | Large halls, queues | Heaviest privacy load; process at the edge, keep counts only |
| Wi-Fi association counts | Devices per access point | Floor or building trends with no new hardware | One person, several devices; coarse areas |
| BLE badges or phone scans | Badge positions or presence | Staff in large sites | Needs tags or an app; that is tracking, not counting |
| CO₂ sensors | Air quality, a proxy for people | Ventilation, rough room use | Lags behind real occupancy |
| Room bookings | Booked vs free | Comparing booked with used | Bookings are not occupancy |
Most buildings mix two or three: door counters for floors and halls, area or desk sensors where utilisation matters, and Wi-Fi counts as a cheap trend line. More on putting each kind on a plan in IoT sensor floor plan monitoring.
Privacy: count, don’t track
Occupancy data can become personal data quickly — a desk sensor in a single office says when one named person is at work. A few habits keep a project on the right side of colleagues and data protection law:
- Store counts per zone, not identities. Most space questions never need to know who.
- Aggregate small spaces. Report single offices as part of a group, or only above a minimum headcount.
- Process at the edge. Camera and thermal sensors should send numbers, not images.
- Say what you measure. Tell people what is counted, why, and how long it is kept.
- Keep it short. Raw readings for weeks; aggregated trends for longer.
- Ask early. Data protection rules differ by country, and in some countries employee representatives must be consulted before sensors go in.
Where to put the sensors
Sensor placement decides what the heatmap can say. Coverage gaps look exactly like empty space, so plan the layout on the floor plan before you buy:
- Door counters at every entrance to the space you measure. Miss one door and the in-minus-out count never balances.
- Area sensors over the zones that matter, with their footprints drawn on the plan so you can see what each one covers and where they overlap.
- Desk sensors on a representative sample if you cannot cover every desk — one neighbourhood per floor tells you a lot.
- Meeting rooms individually. Rooms are the spaces most often booked and least often used; measure each one.
- Nothing in private spaces. Restrooms, prayer rooms and first-aid rooms stay out of scope.
Put each sensor on the map as a marker at its real position, with its coverage as an area. When a zone looks quiet, you can check in one glance whether it is quiet or simply unmeasured.
From counts to a floor-plan heatmap
A heatmap is drawn from points. Each point adds heat where it sits, scaled by a weight. So the job is to turn sensor output into points with a sensible weight:
- 1One row per sensor or zone
Give each row a position (longitude and latitude, or the name of the room it measures), a count, a capacity and the time of the reading.
- 2Pick the weight
The raw count shows where people are. A share of capacity — count divided by seats — shows which spaces are full. Compute it in the source or in a field of the table.
- 3Turn on the heatmap
In the viewer’s Heatmap control, choose the occupancy layer, weight it by the count or the share field, and pick the floor. “Heatmap and items” keeps sensor markers on top; “Heatmap only” shows just the density.
- 4Or colour the rooms
For “which meeting rooms are full right now?”, colouring each room by its share of capacity with style rules is clearer than heat. Use both: rooms coloured, heat for the open plan.
Two details make an occupancy heatmap honest on a real floor plan. In Spatial Map, heat stops at walls and closed doors, so a packed room does not spill into the corridor next to it; and the heatmap shows one floor at a time, because stacked floors would blur together. Several layers can share one map, each in its own colour — desks and meeting rooms, for instance — though weighting by a number works with one layer. The indoor heatmap software page covers the control in full.
Reading occupancy data well
- Peaks and averages answer different questions. Capacity planning needs the peak; space reduction needs the typical day.
- Look by hour and weekday. Tuesday at 11:00 and Friday at 15:00 are different buildings.
- Reset door counters. In-minus-out drifts; a nightly reset to zero keeps occupancy believable.
- Empty may mean unmeasured. Check sensor coverage before you call a zone unused.
- Alert on what needs action. An in-app alert rule such as “number of people in Hall B above 450” turns a heatmap into something a duty manager acts on.
The Lakeside Convention Center demo has occupancy and environment sensors in its halls, an occupancy log table and a Crowd & Occupancy report; the Harborview office demo adds meeting rooms and space use. Try it on your own plan with a 7-day free trial — Pro is $60 a month for up to four facilities.
Try the platform your data belongs on.
Spatial Map turns spreadsheets, sensor streams, and CAD drawings into one live 3D facility view — nothing to install, seven-day free trial.
Keep reading
- Use caseWarehouse heat map: from an Excel template to a live floor planA spreadsheet heat map is perfect for a slotting review. Congestion, travel and live stock need positions and a real floor plan. Here is which tool answers which question — and how a map heatmap that stops at walls changes the picture.
- Use caseAirport terminal operations on a live map: RFID bag tags, queues and gatesA terminal runs on hand-offs: from check-in to screening, from the gate to the carousel. Each hand-off happens in a place, so each one belongs on a map. Here is how our Silverbay Terminal 2 demo puts bag tags, queues, gates and crowding on one live two-floor view.
- Use caseCross-dock and yard visibility on a live map: dock doors, trailers and gatesA cross-dock runs on timing: which door is turning, which trailer has sat in the yard too long, which gate lane is backing up. Putting the building and the yard on one live map makes those answers visible at a glance. Here is how, using our Eastport Cross-Dock Freight Hub demo.