Logistics — Spatial Map Solutions
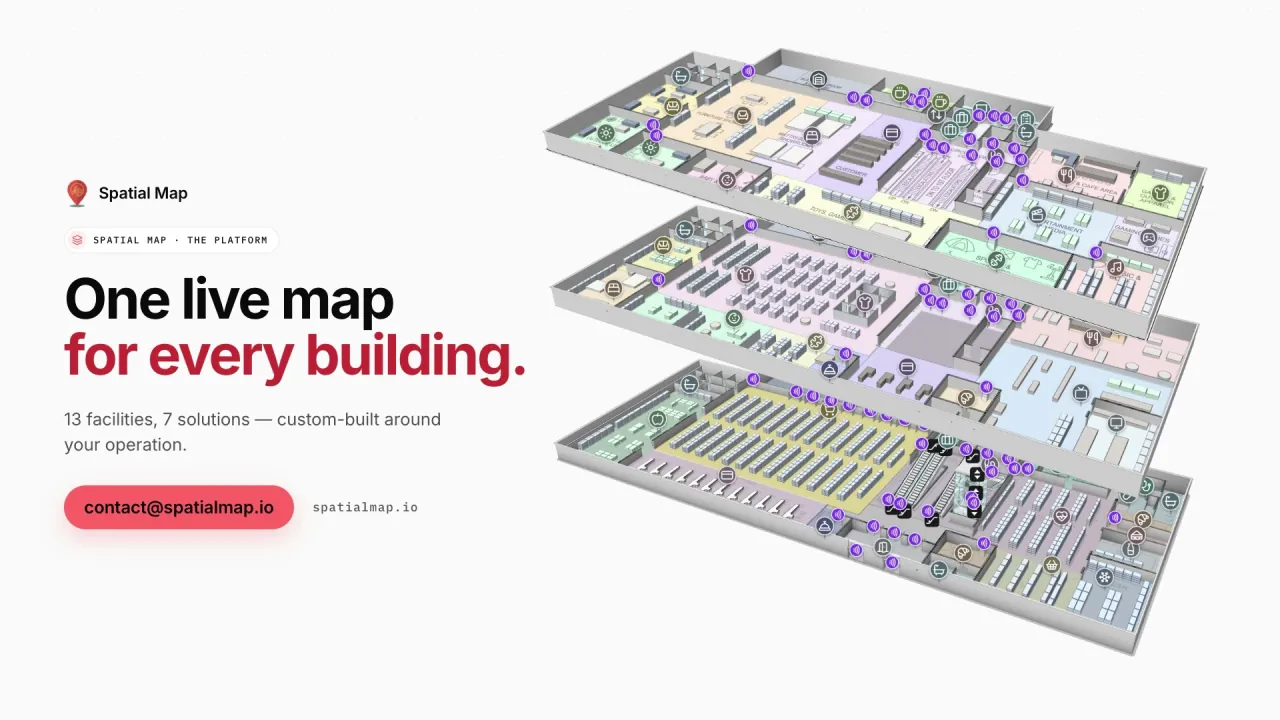
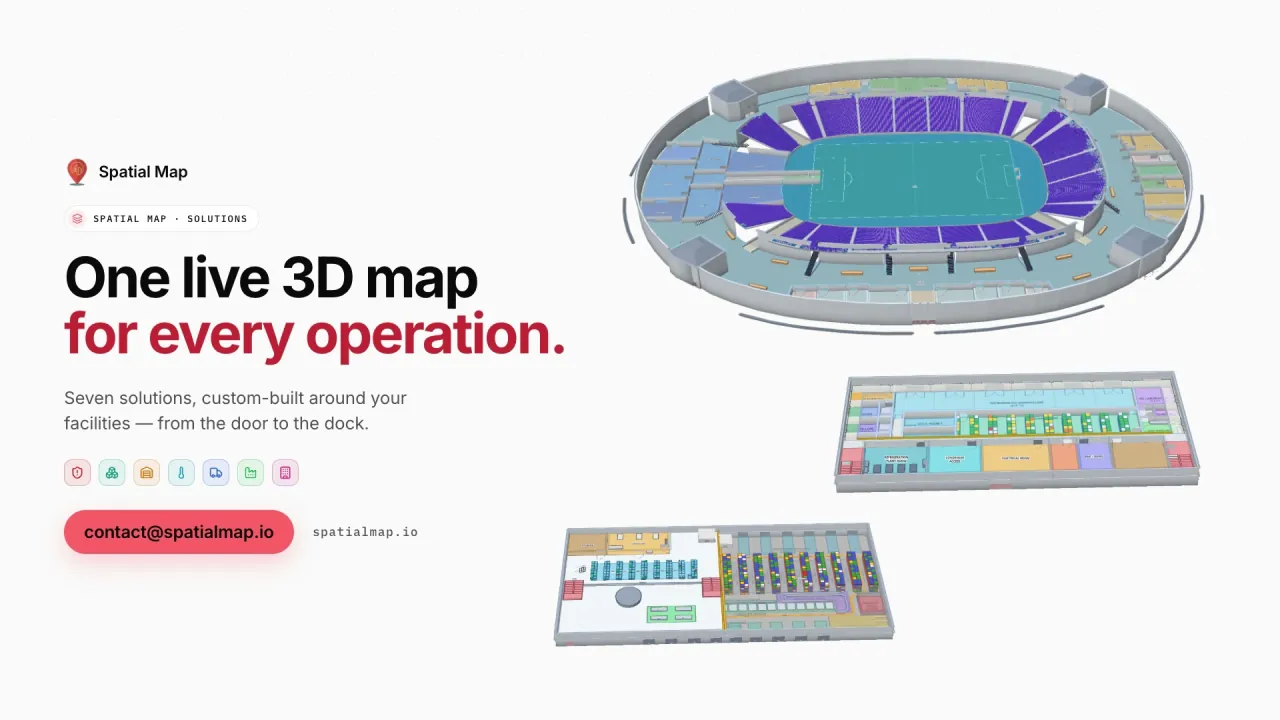
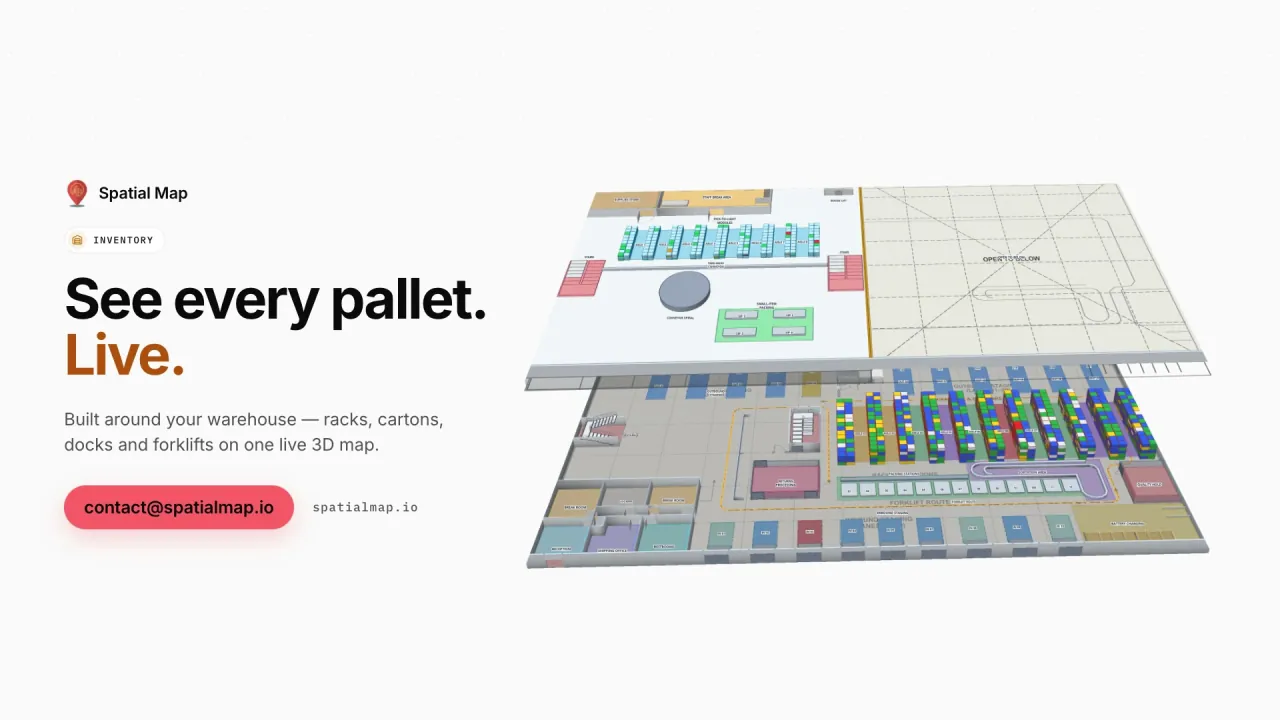
Eastport Cross-Dock, a demo freight hub, live in 3D: 50 dock doors, 44 yard slots and 1,180 RFID pallets, the gate and weighbridge, a pallet staged in the wrong lane, short loads before cut-off and the dock, gate and yard reports.
Music only, no voice-over. Filmed in the Spatial Map demo workspace: fictional facility names, real 3D renders and demo data.
In this film
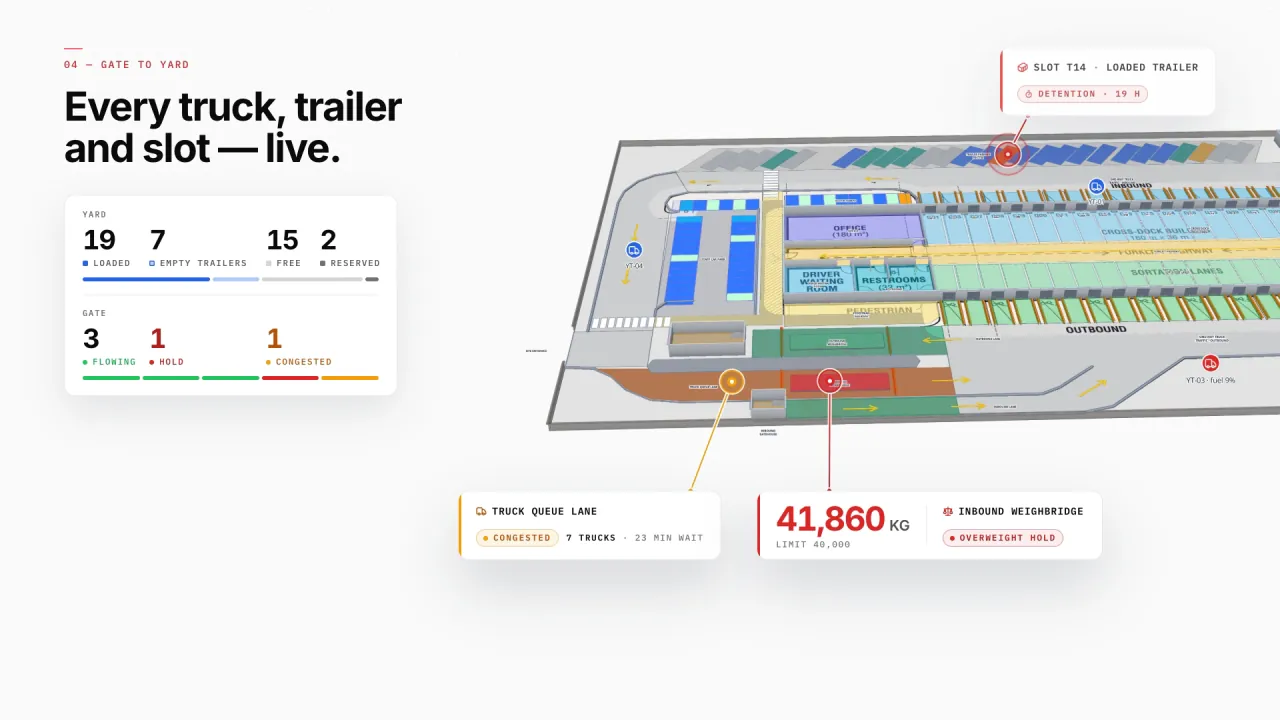
Dock doors, yard and gates in 3D
Eastport’s dock doors, sortation lanes, yard slots, gate lanes and parking sit on the real site plan, with trailers, tractors and sensors live — a loaded trailer in detention, a congested truck lane and an overweight hold show where they are.
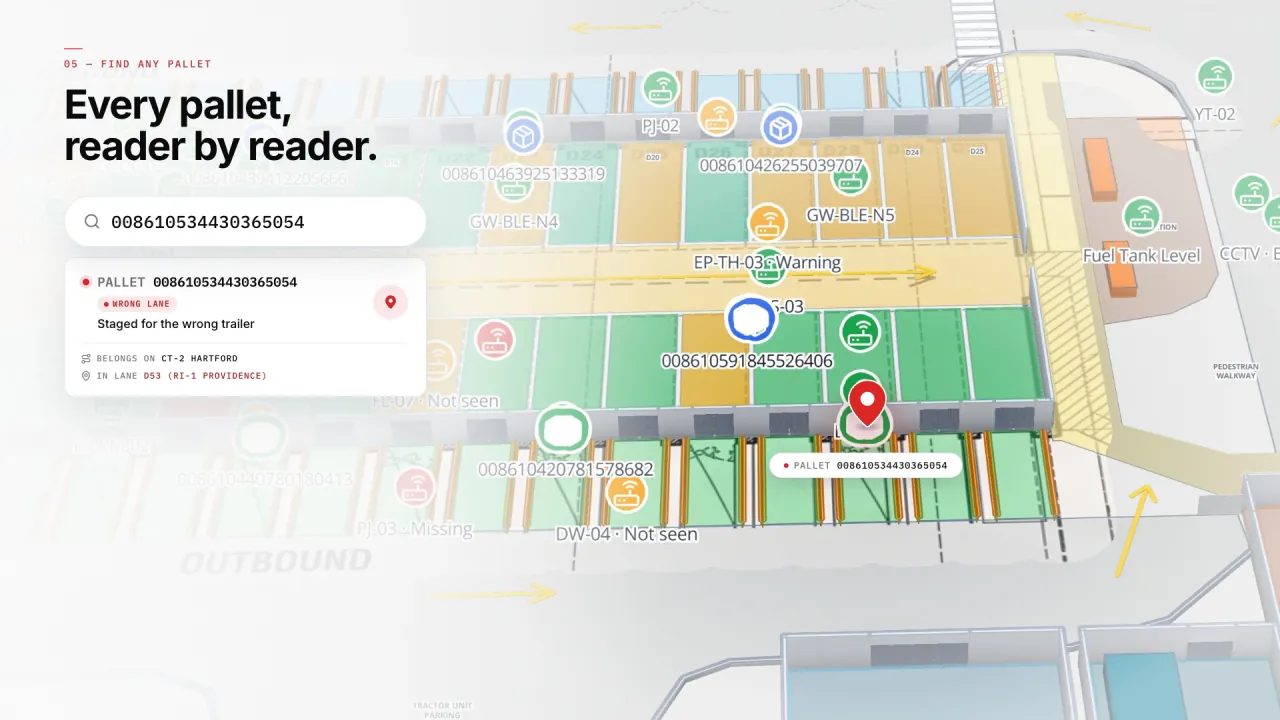
Any pallet, found
Search a pallet ID and the map goes to its last read — here a pallet staged in the wrong lane, pulled back before it was loaded.
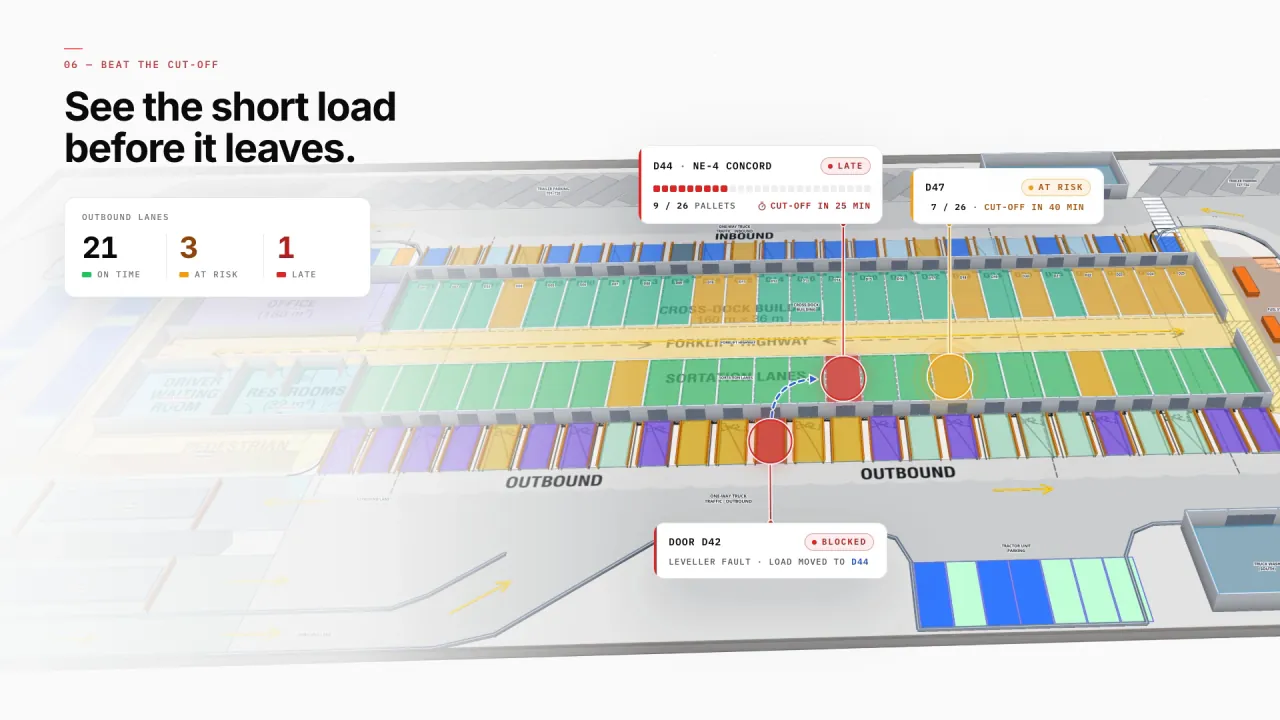
Short loads before they leave
Outbound doors show pallets loaded against each trailer’s cut-off, so a late load or a blocked door is visible while there is still time to move it.
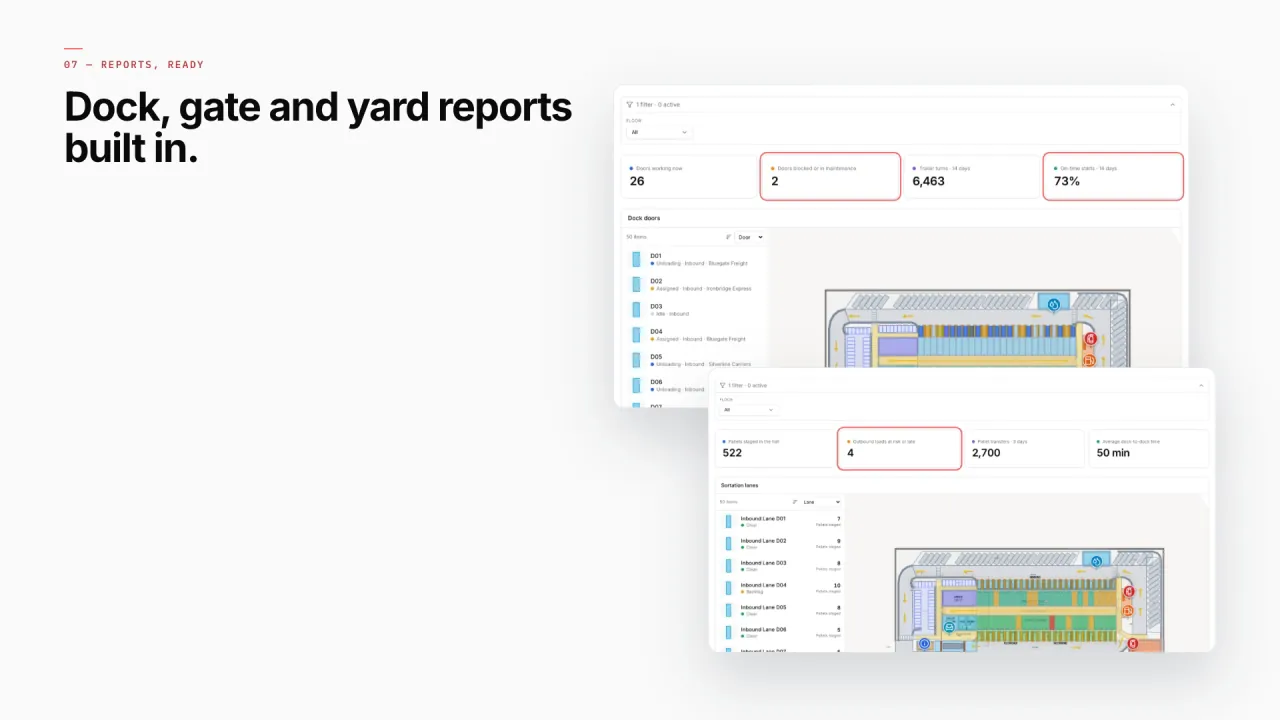
Dock, gate and yard reports
Turn dock, yard and gate tables into KPIs, charts and lists in the report builder — detail, summary, editable or history reports, filterable by time window and parameters, each with the site map beside it. Every report exports to PDF, Excel, CSV or JSON.