Asia-Pacific · New Zealand

Indoor mapping and IoT monitoring software for New Zealand

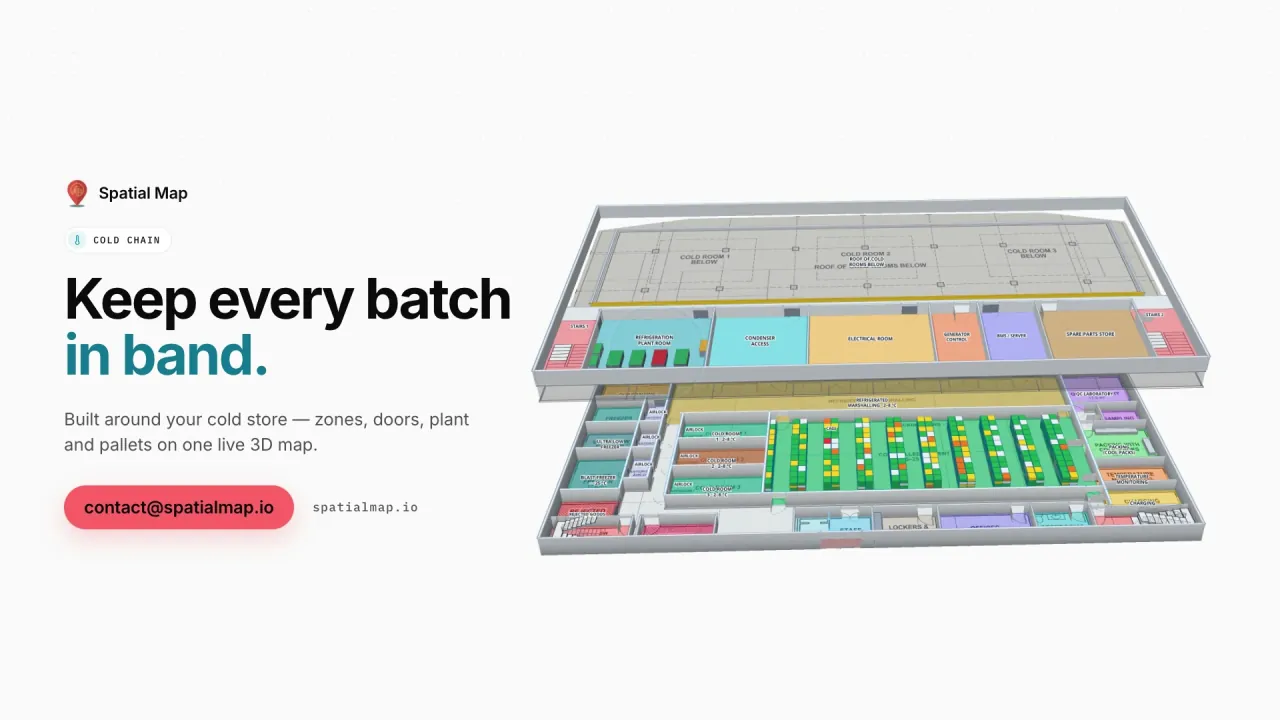
New Zealand earns its living by keeping food cold on its way to the other side of the world. Spatial Map turns the coolstores, freezers and export warehouses behind that trade into live 3D maps in the browser — each room coloured by its temperature, doors and held pallets in place — and it is simple enough for a small team to set up without an IT project.

No credit card. Runs in the browser. Pro is $60/month for up to 4 facilities. Book a demo

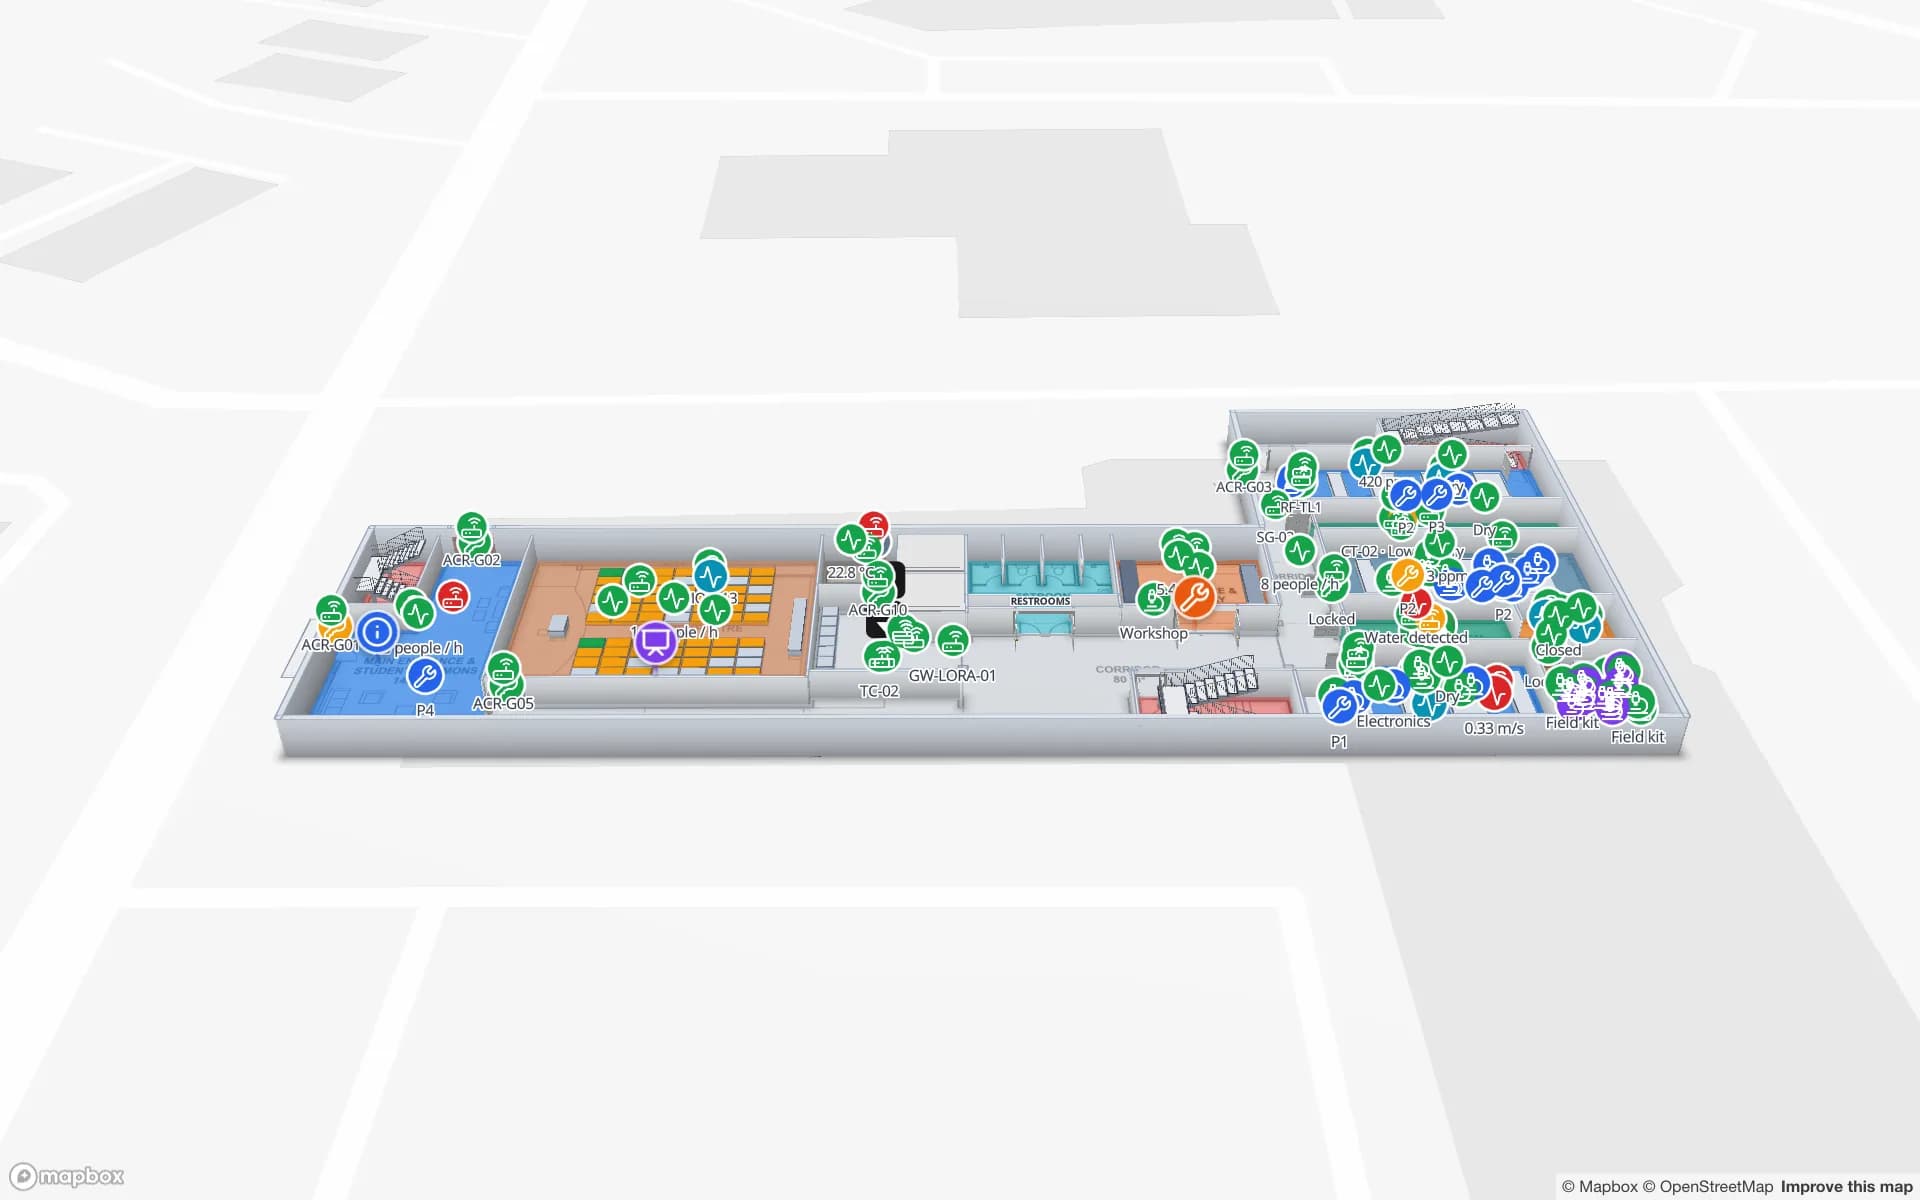
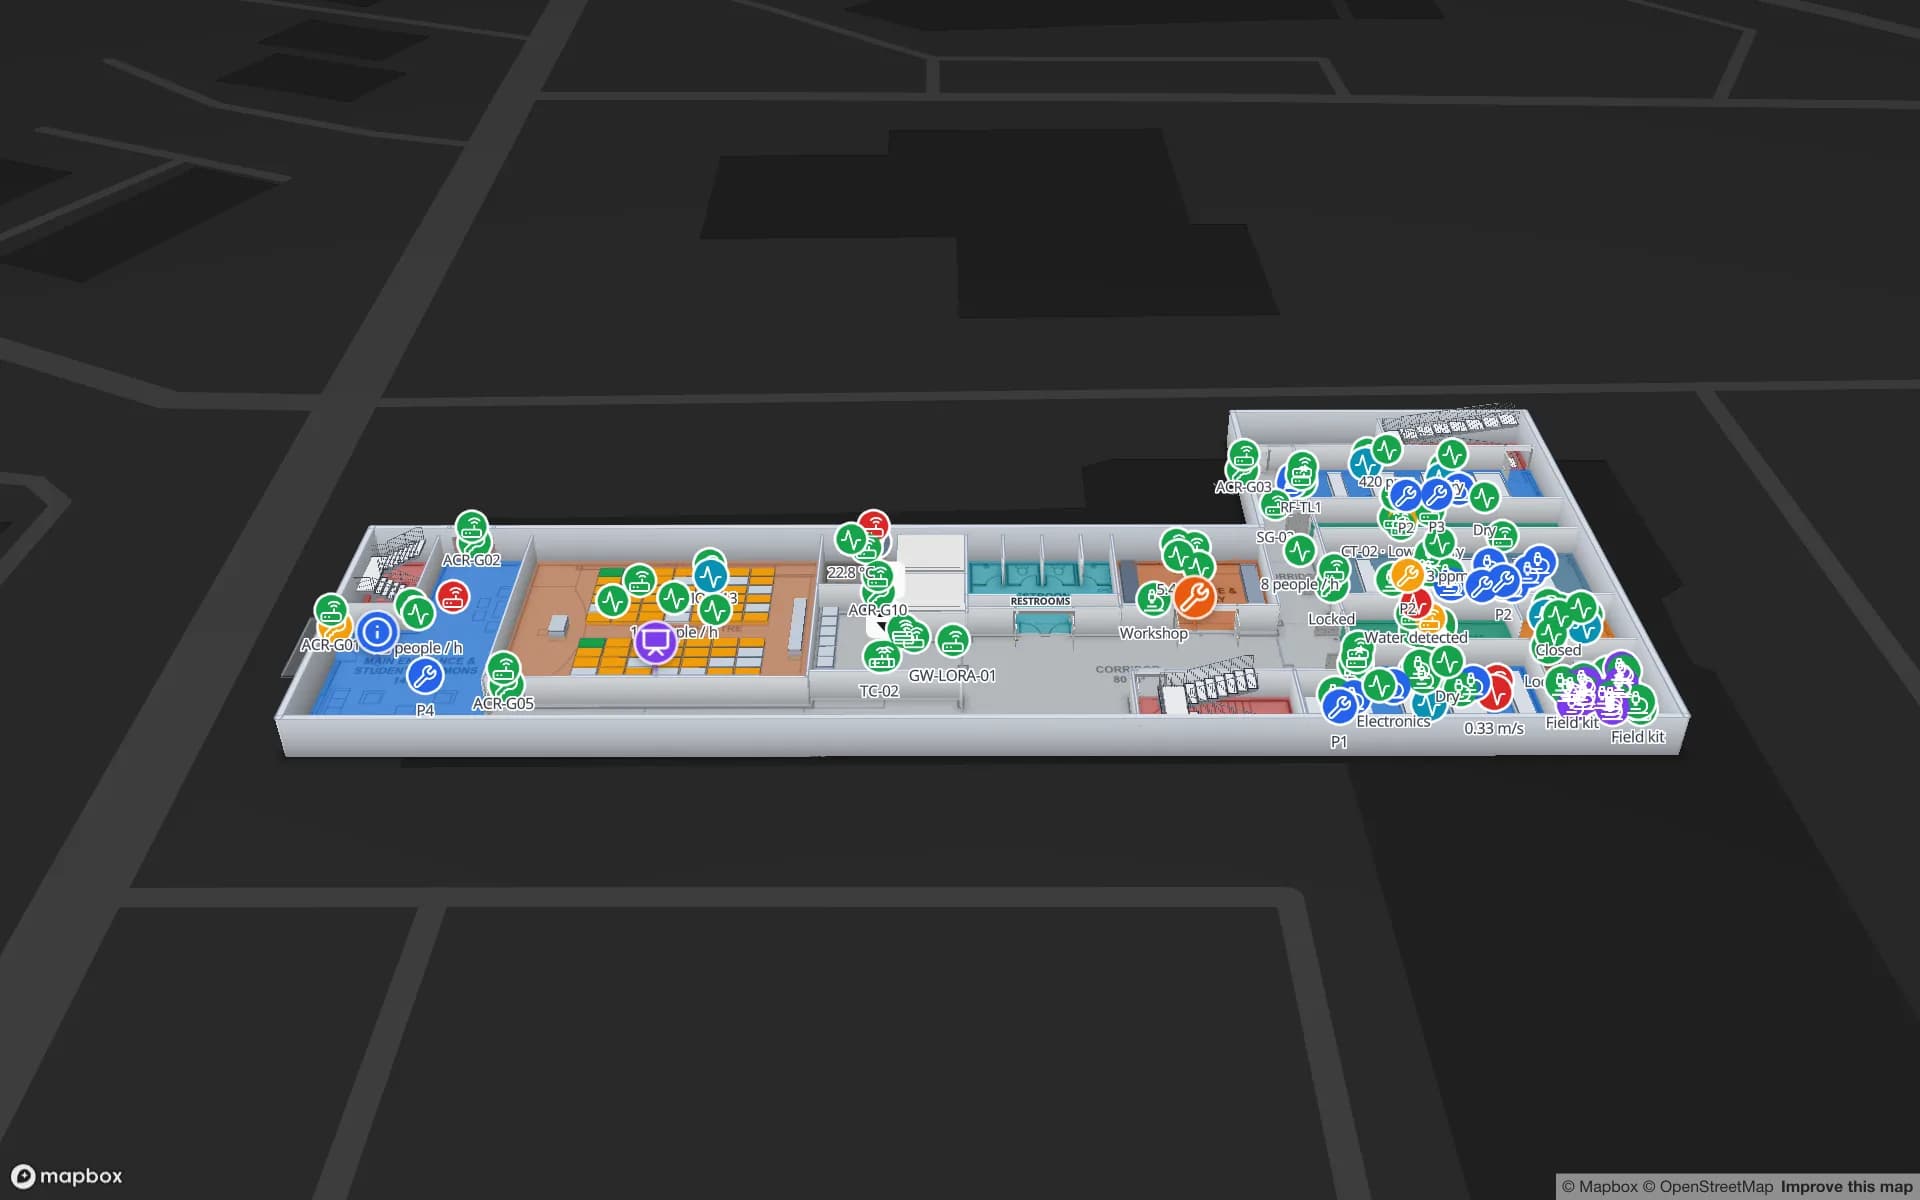
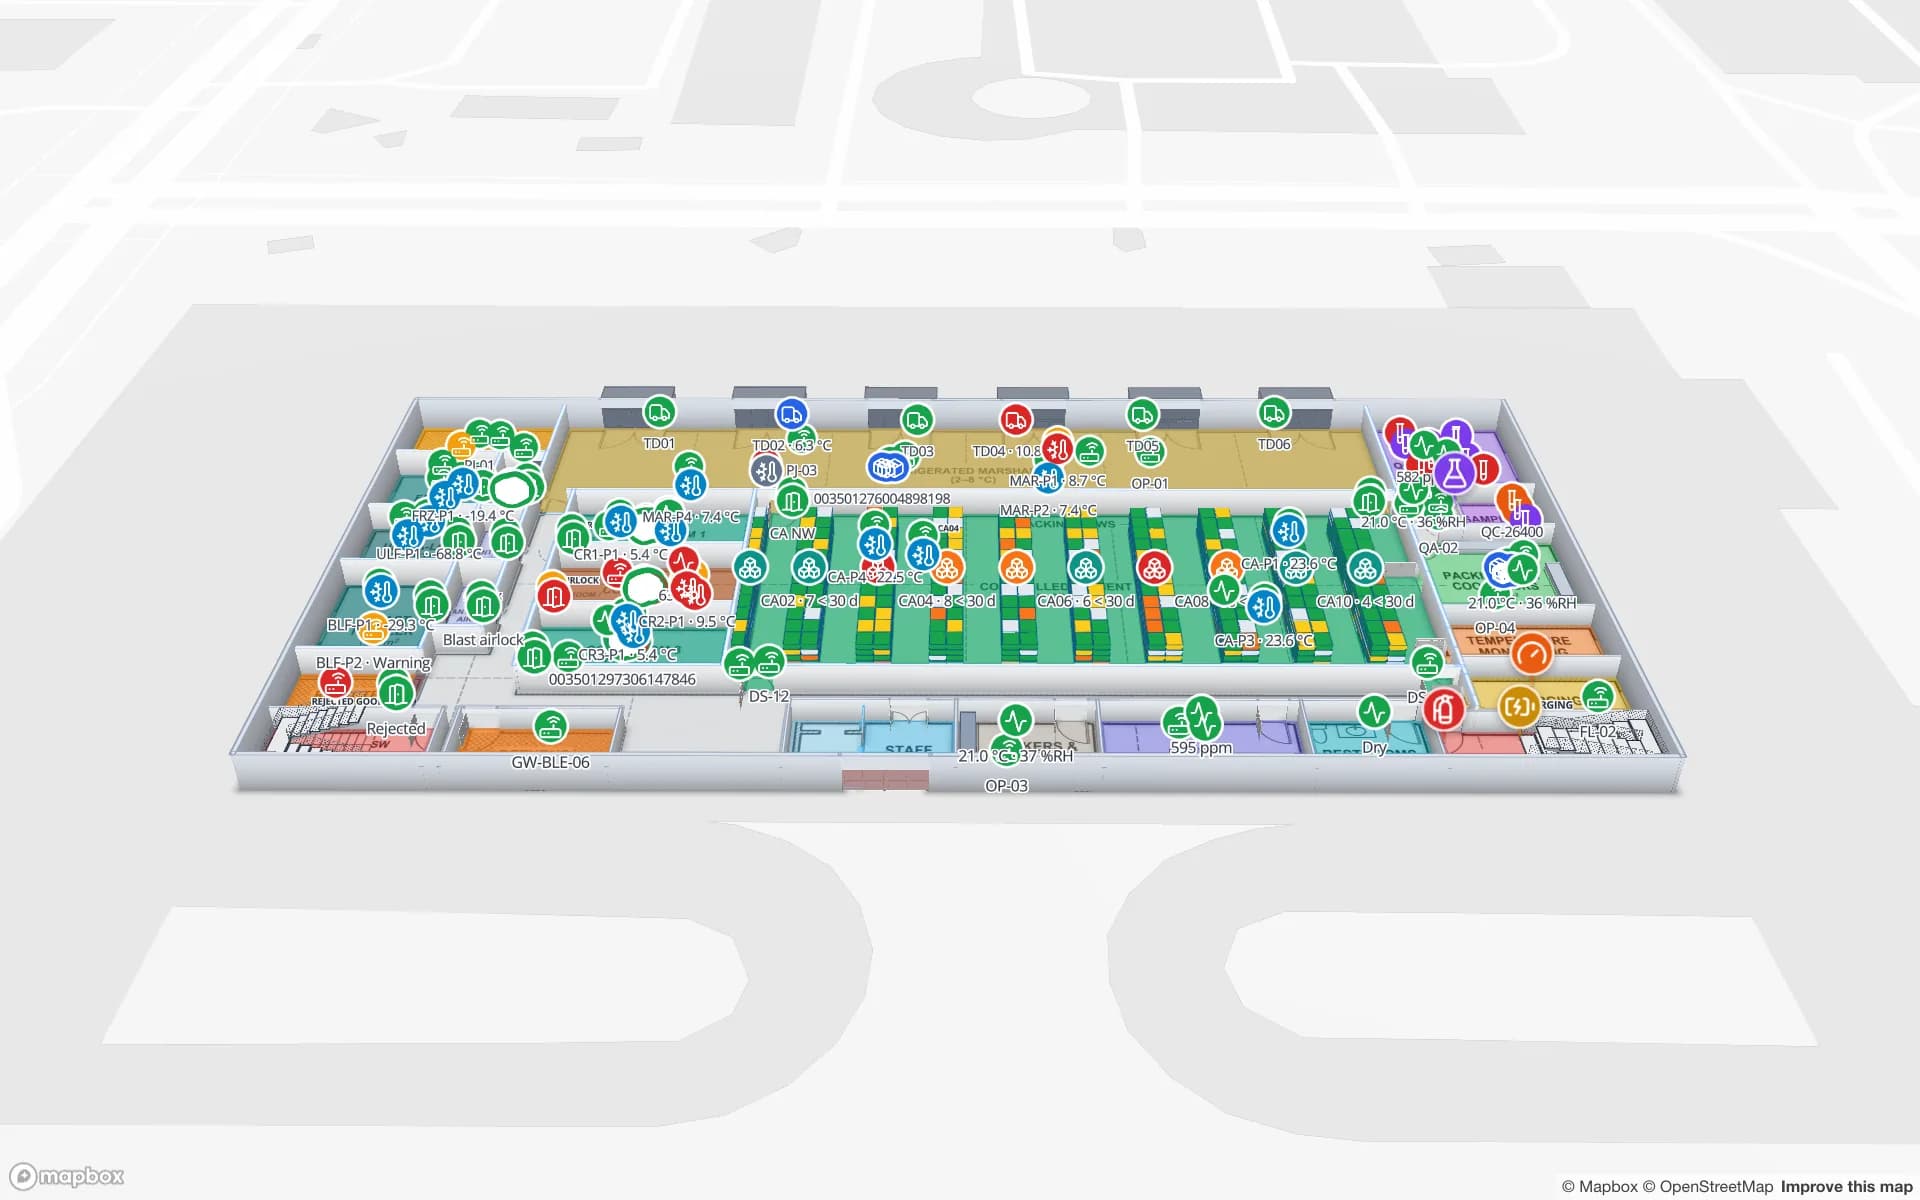
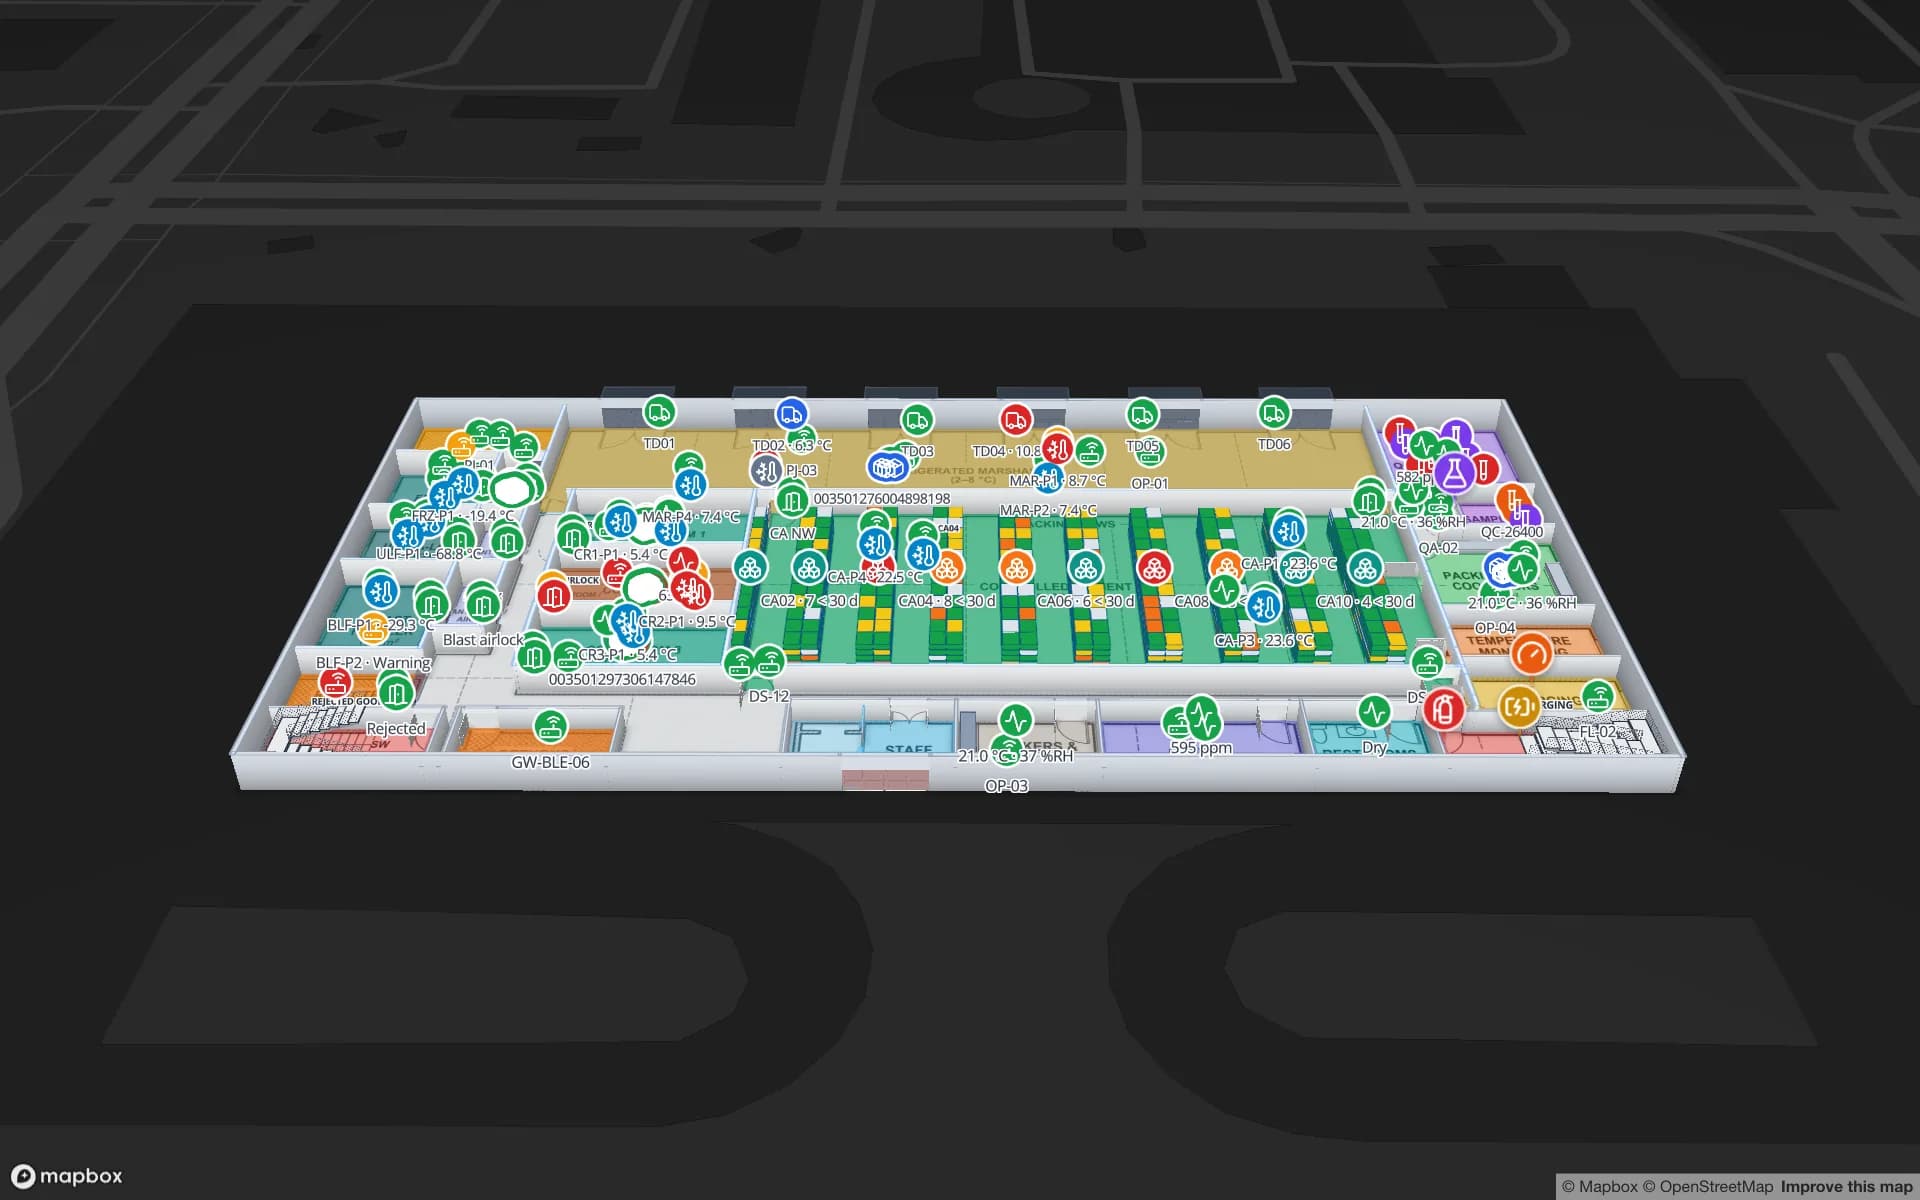
Polar Pharma — Cold Storage & QC Facility, a pharmaceutical cold store & qc lab demo, in the Spatial Map 3D viewer with live device markers
Polar Pharma — Cold Storage & QC Facility
Polar Pharma, a demo cold store and QC lab: cold rooms, freezers and controlled-ambient zones coloured by live temperature, with doors and held pallets across 1,140 rack locations.
Rack locations in the Polar Pharma demo cold store
1,140
Software to install — runs in any modern browser
0
Demo facilities to explore online
13
Free trial, up to 5 facilities, no credit card
7 days

Dairy, meat and kiwifruit on their way out

Dairy products are New Zealand’s largest export, and meat, kiwifruit, apples, wine and seafood follow close behind. Between farm or orchard and ship, almost all of it passes through coolstores, freezers and packhouses — butter and cheese in chilled stores, frozen lamb and beef in freezers, kiwifruit held for months in controlled coolstores before it is shipped.

Spatial Map shows those buildings room by room. Readings from your temperature and humidity sensors arrive through the gateway or IoT platform you already use and colour each room by style rules on the value; door states, held pallets and dock activity sit in the same view. Every change is kept in row history, so a supervisor can replay what happened overnight. Your food-safety and export procedures remain the record.
Port of Tauranga and Auckland

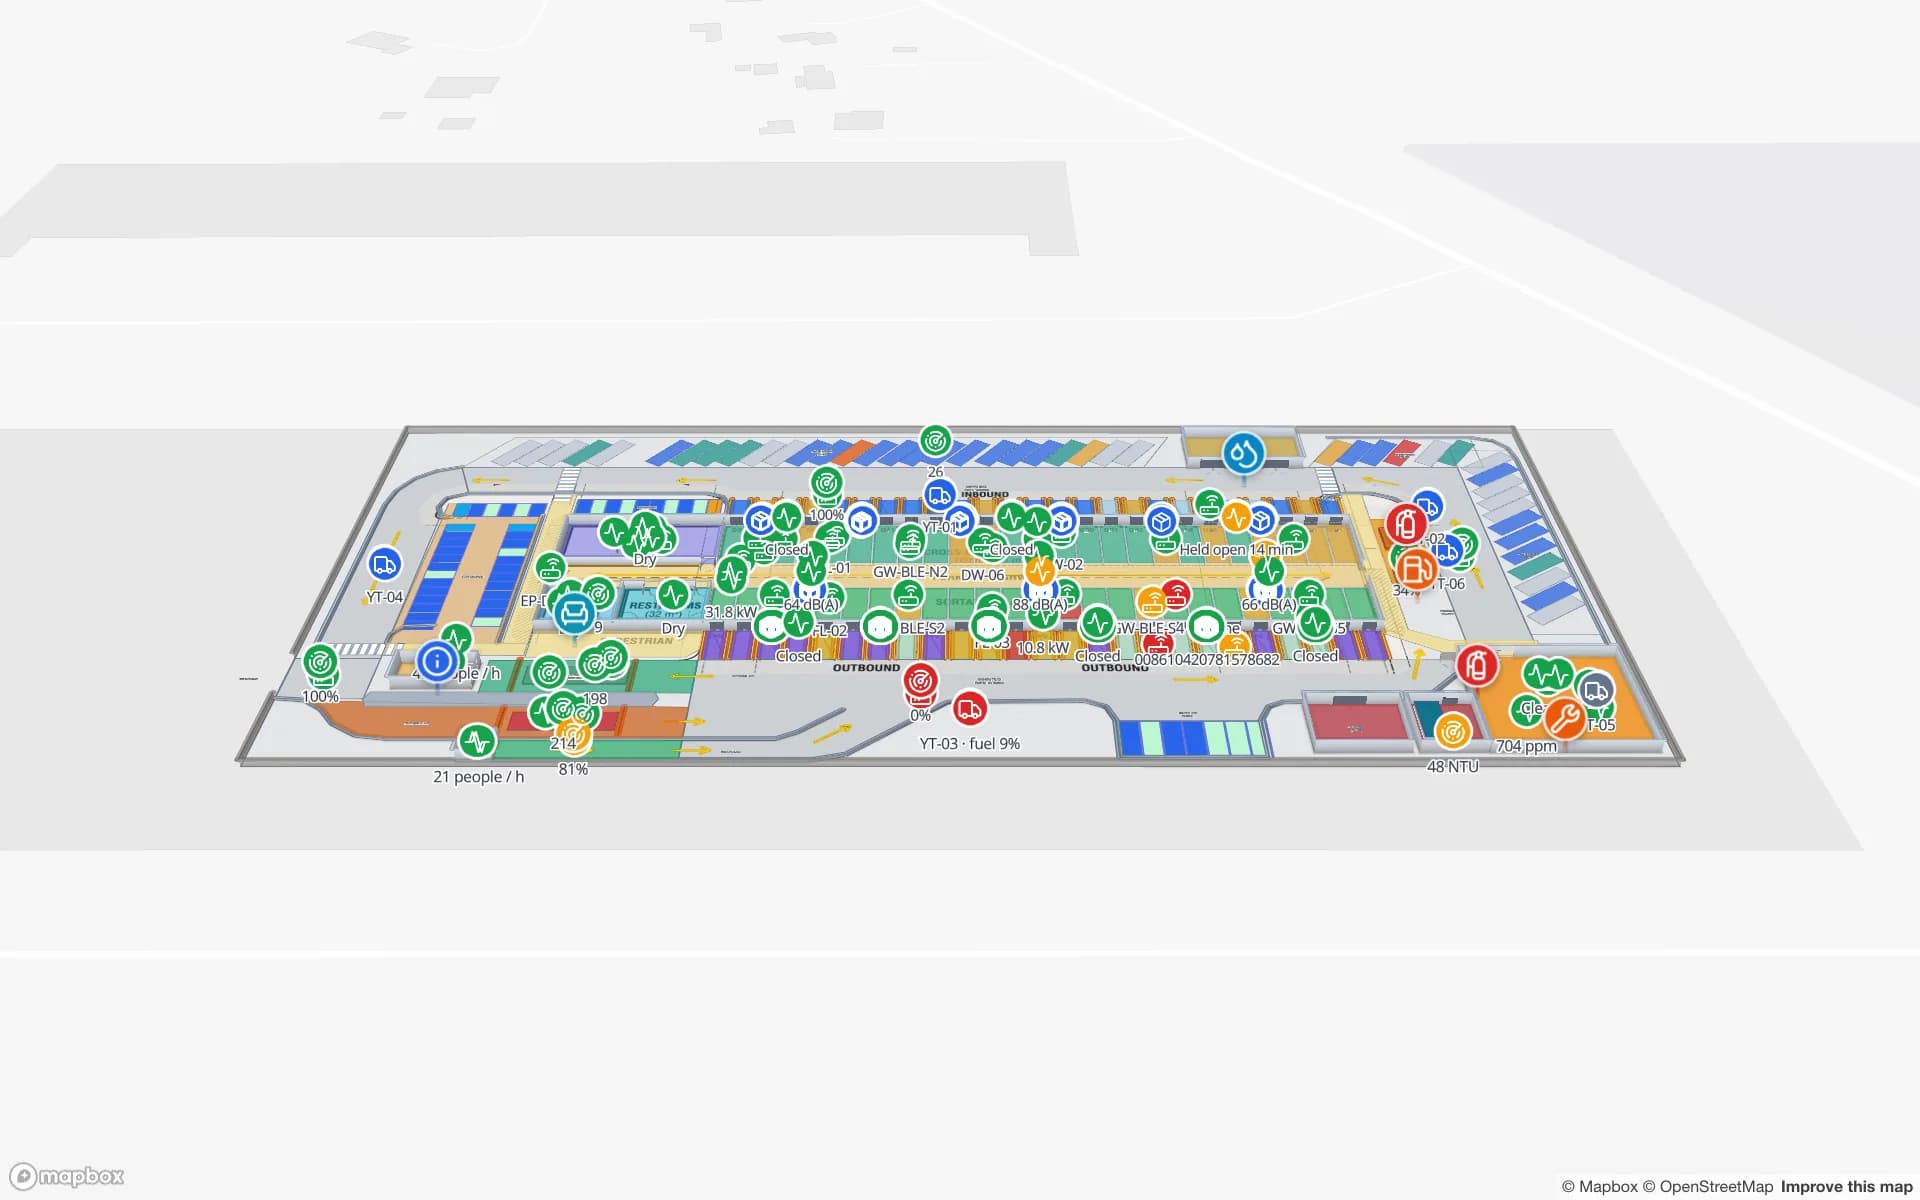
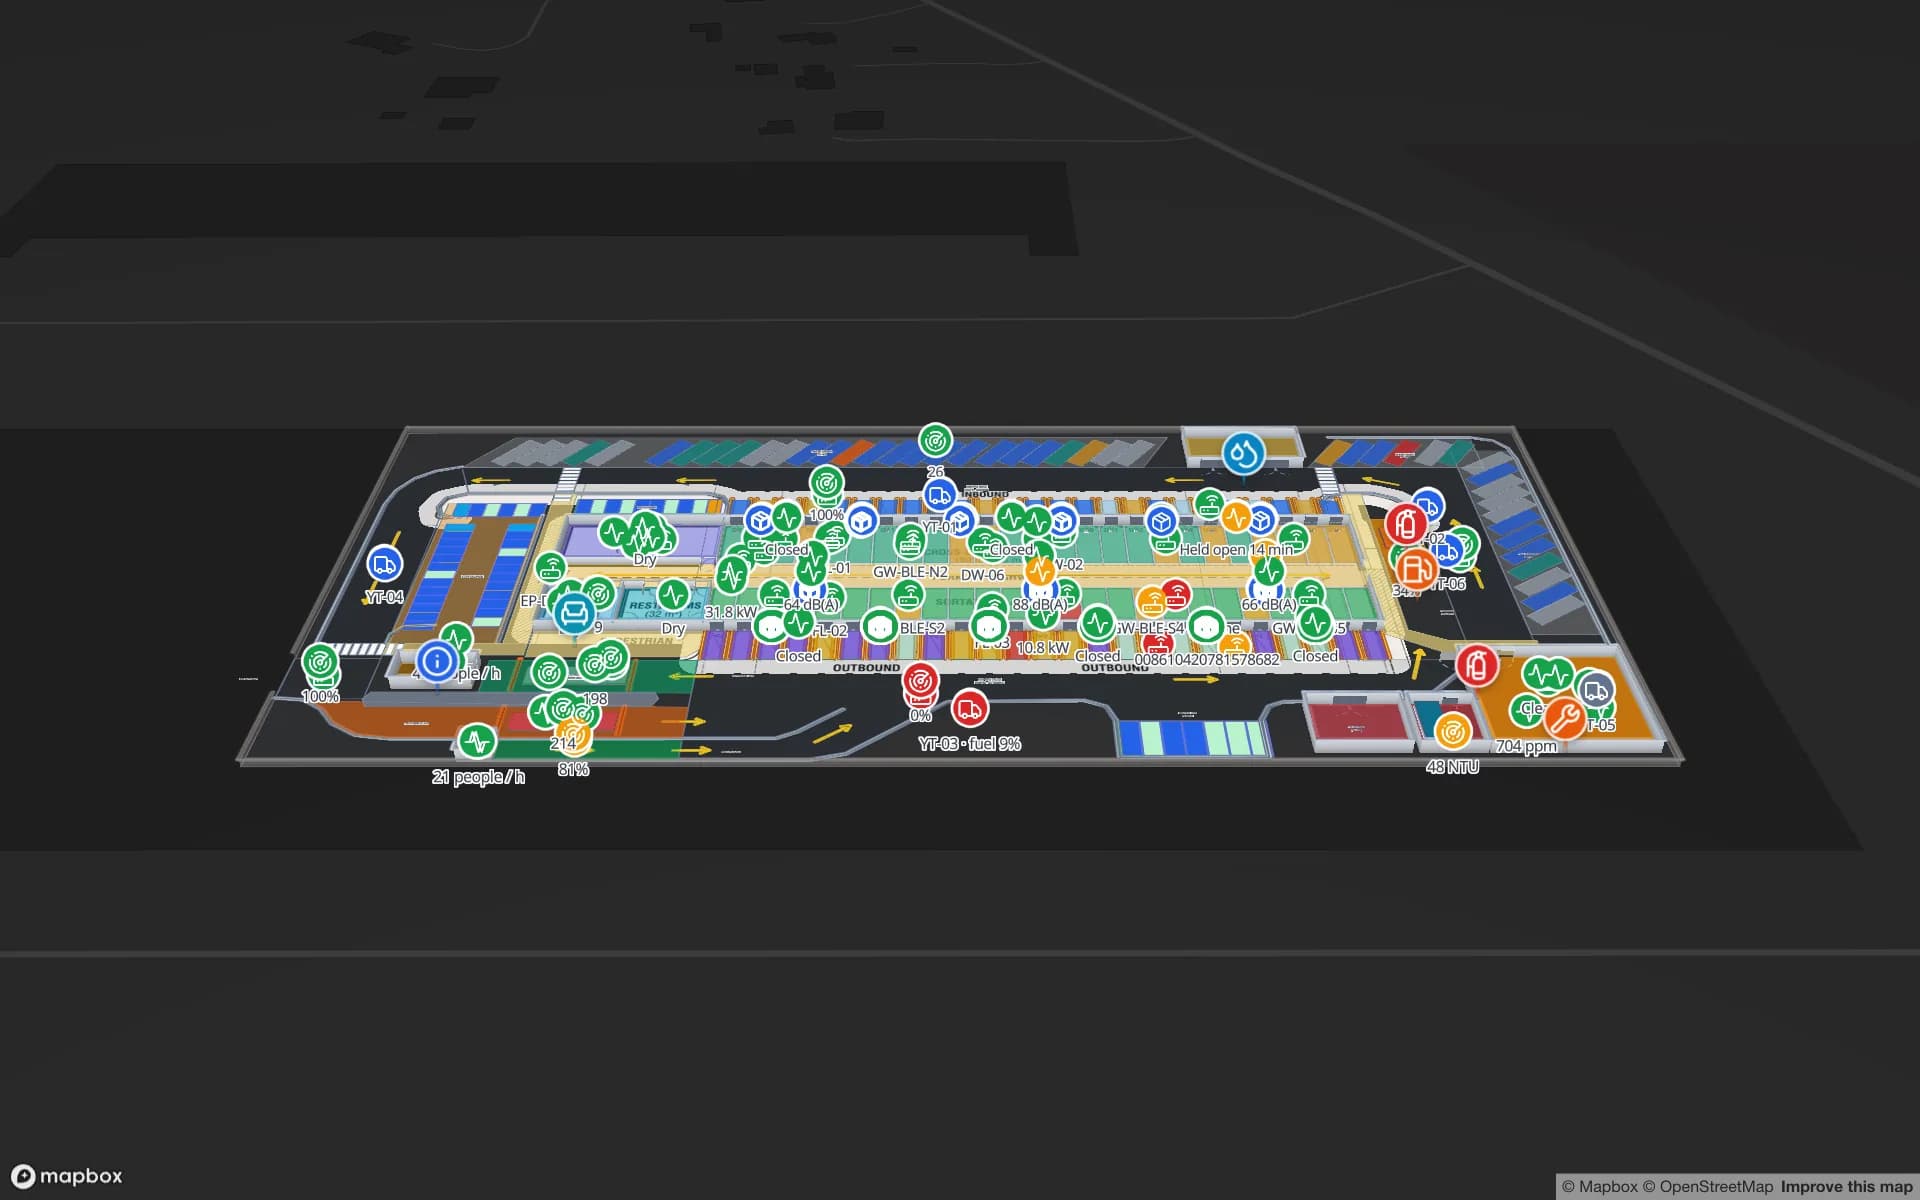
The Port of Tauranga is New Zealand’s largest port and the main gateway for Bay of Plenty kiwifruit and much of the country’s dairy and forestry exports, while Auckland is a major import gateway for consumer goods. Around both sit coolstores, container packing sheds and distribution centres where pallets are consolidated against vessel cut-offs.

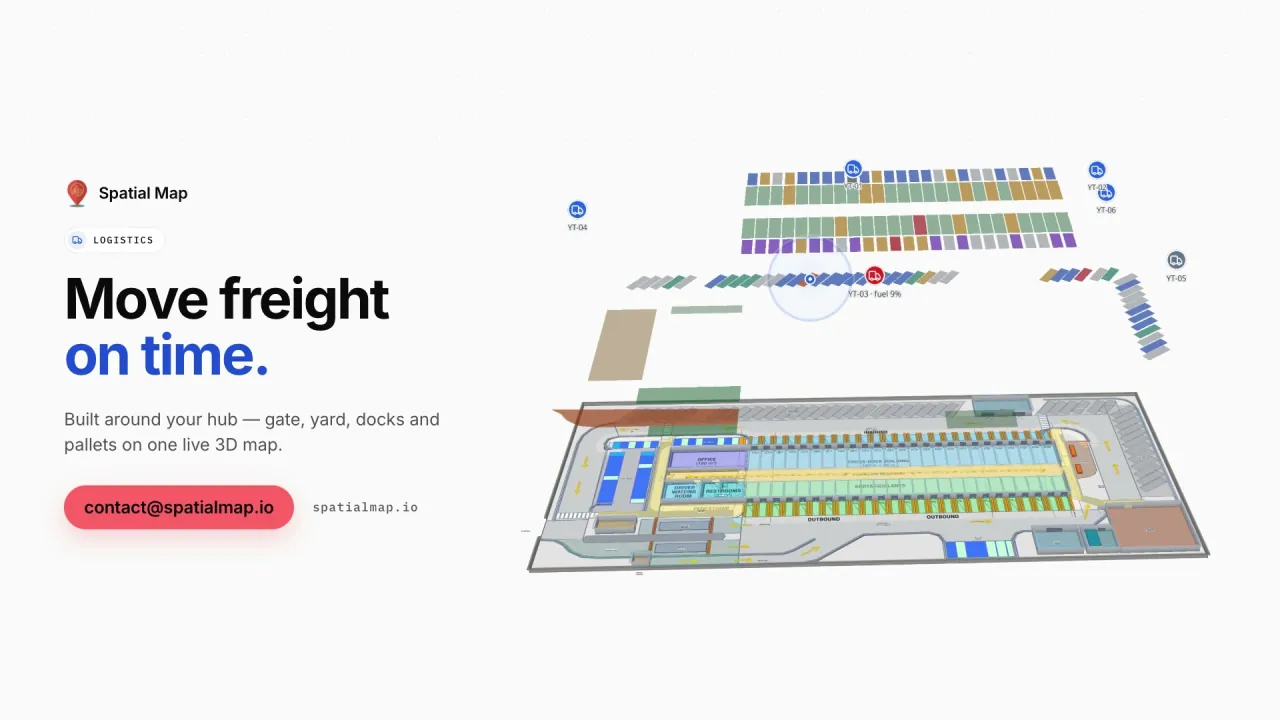
Dock doors, staging lanes and container packing bays are drawn on the site plan and coloured from your WMS or yard data, so the team can see what is staged for which container and what is still waiting. The Eastport Cross-Dock demo shows the pattern with 50 dock doors and 44 yard slots.

Sized for small teams

Many New Zealand operators run lean: the person responsible for the coolstore may also look after the forklifts, the IT and the export paperwork. Spatial Map does not need a project team. Upload the building plan as a PDF or DWG, draw the rooms, racks and doors, connect a CSV export or a REST endpoint, and the map is live. The 7-day trial covers up to 5 facilities, and Pro is $60 a month or $600 a year for up to 4 facilities.

If there is no time to do it yourselves, our services team builds the facility and connects your data as a fixed-price custom service, with a proposal within 3 business days.

Universities, research and venues

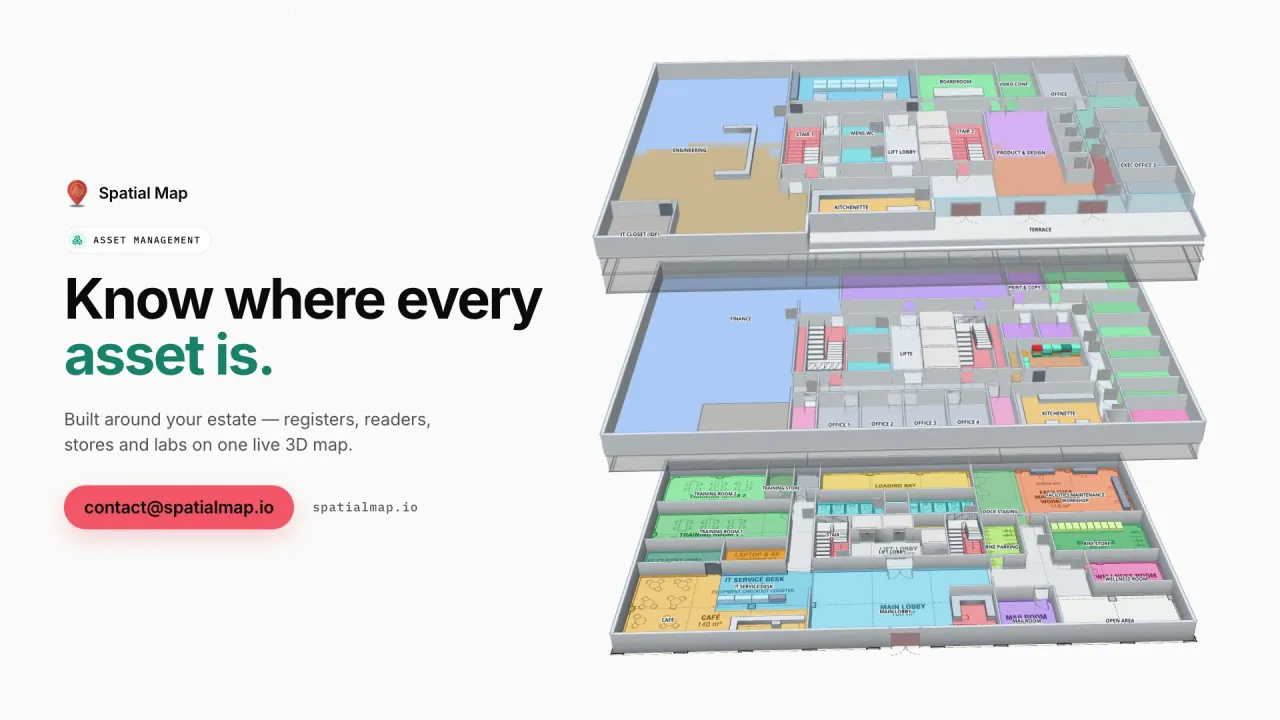
New Zealand’s universities and research institutes share expensive instruments between labs, buildings and campuses, and the question is often simply where a piece of equipment is and whether it is calibrated. The Westbrook University demo shows a science building with labs, instruments, bookings and calibration dates on the map.

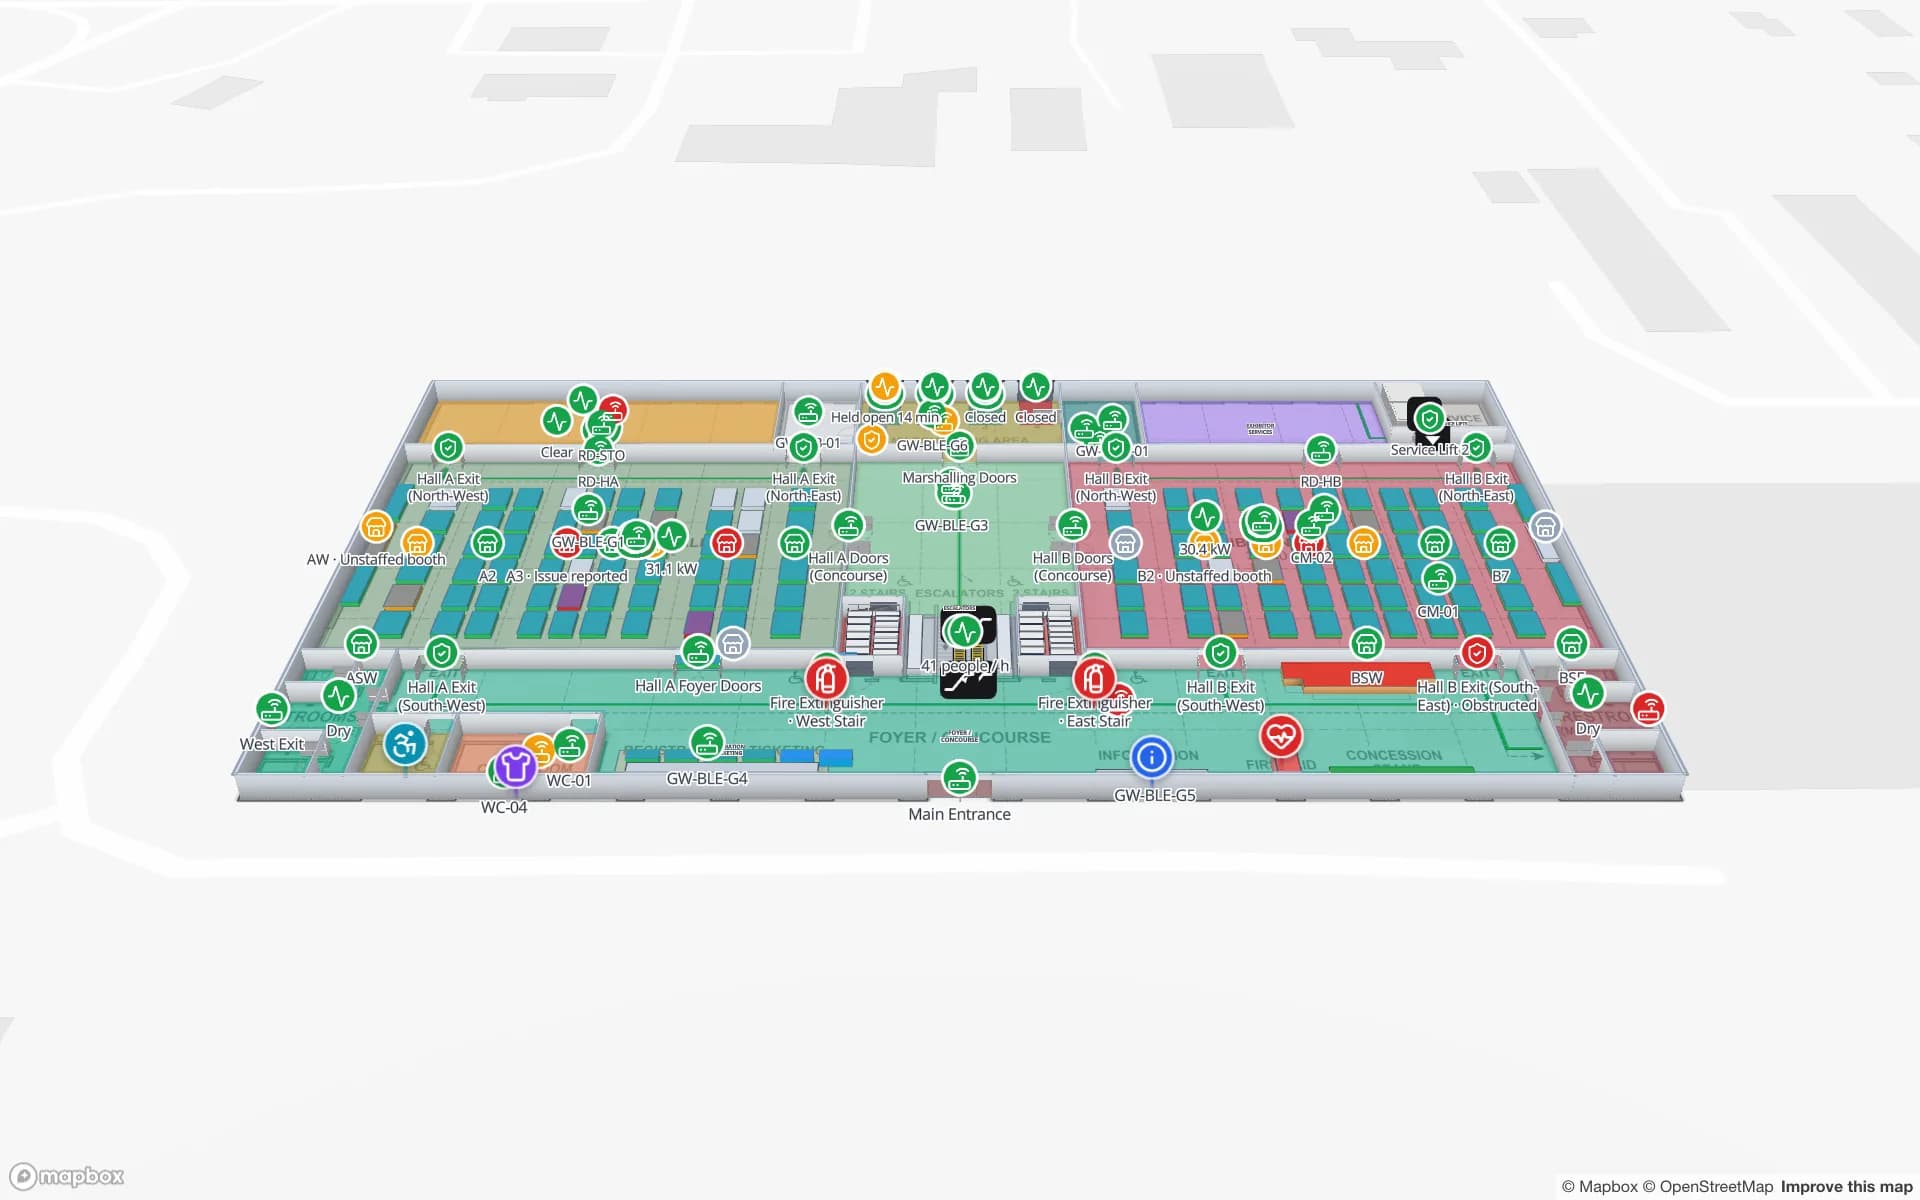
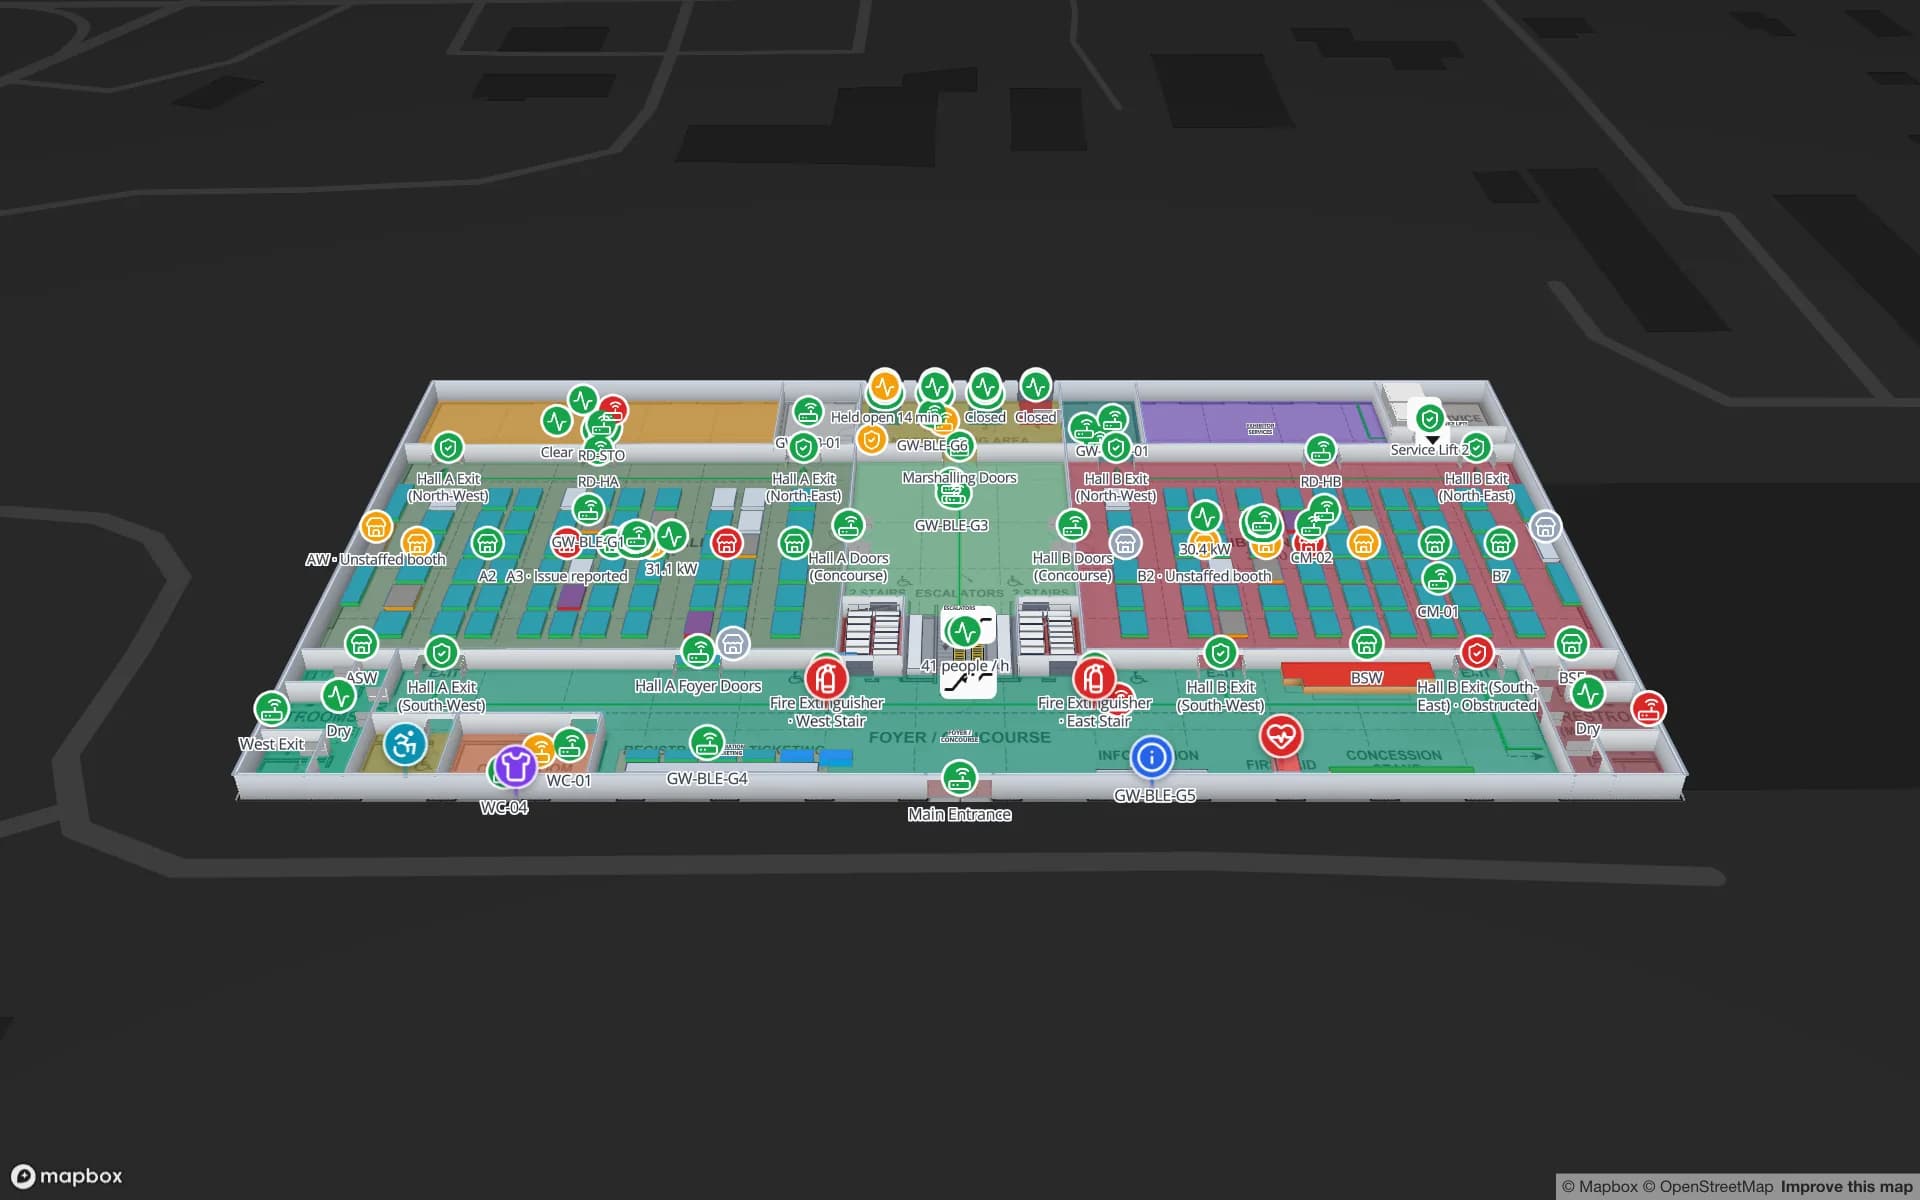
Stadiums, event centres and convention venues use the same platform for event days: halls, rooms over capacity, crews and deliveries on a live map, as in the Lakeside Convention Center demo. Wayfinding builds walking routes around walls and through doors, also on share links for visiting crews.

Privacy Act 2020 and working with us

The Privacy Act 2020 and its information privacy principles are the context whenever location data can be linked to people, and the Office of the Privacy Commissioner publishes guidance on workplace monitoring. Your legal advisers decide what applies; most cold-chain and warehouse projects monitor rooms, pallets and equipment rather than staff. A data processing agreement is available and the security page describes how data is protected.

Spatial Map is sold online at the same USD price worldwide. Our team works with New Zealand customers remotely, by video call and through the contact form; room names, column names and report titles — te reo Māori included — appear exactly as you write them.

How Spatial Map does it

From coolstore plan to live map

  1. 01

    Upload the plan

    A PDF or a DWG (AutoCAD R2004–R2018) of the coolstore, packhouse or warehouse, placed at scale.

  2. 02

    Draw rooms and racks

    Cold rooms, freezers, racks with their locations, dock doors and packing bays.

  3. 03

    Connect the sensors

    Your gateway or IoT platform posts readings to a table, or Spatial Map polls its REST endpoint.

  4. 04

    Watch, replay, report

    Rooms coloured by temperature, history playback and reports in PDF or Excel.

What New Zealand teams use it for

Dairy and meat cold stores

Chillers and freezers coloured by live temperature, with held pallets in place.

Kiwifruit and produce coolstores

Rooms, doors and stored lots on one map through the storage season.

Export consolidation near the ports

Pallets staged by container and vessel cut-off at the dock doors.

University instruments

Lab equipment with its location, bookings and calibration dates.

Event centres and venues

Halls, room capacity and crews on event days.

See it on real demo facilities

Fictional names, real floor plans, live sensors, RFID, BLE tags and gateways — open any of them in the browser.

All 13 demo facilities

Questions from New Zealand teams

Yes. There is nothing to install: upload a floor plan, draw the rooms and racks, and connect a CSV export or a REST endpoint. If you would rather not do it yourselves, our services team builds it as a fixed-price custom service.

Yes. Your sensors’ gateway or IoT platform posts readings to a table or exposes a REST endpoint that Spatial Map polls; rooms are coloured by style rules on the value and every change is kept in row history. Spatial Map shows the state on the map and in reports; it does not send notifications.

It is context for your project when data relates to identifiable people; your legal advisers decide what applies. Spatial Map only shows the data you send it, and most cold-chain projects monitor rooms, pallets and equipment rather than staff.

No. Spatial Map is sold online and our team works with customers remotely, by video call and through the contact form.

The same worldwide, in US dollars: a 7-day free trial for up to 5 facilities with no credit card, then Pro at $60 a month or $600 a year for up to 4 facilities. Larger sites are quoted as custom services.

Map your first New Zealand coolstore this week.

Start the free trial, or send us a building plan and a sample of your sensor data through the contact form and we will show you your own site live.