Denmark · Danmark

Indoor mapping and RFID tracking software for Denmark

A few Danish industries carry a large share of the country’s exports: pharmaceuticals and life sciences, wind-energy equipment, and food such as pork and dairy. Each depends on buildings where material must be in the right place and condition — quarantine and released stock, very large components in halls and yards, chilled and frozen goods. Spatial Map turns those buildings into live 3D maps in the browser, fed by the systems you already run. The interface is in English; Danish is not available.

No credit card. Runs in the browser. Pro is $60/month for up to 4 facilities. Book a demo

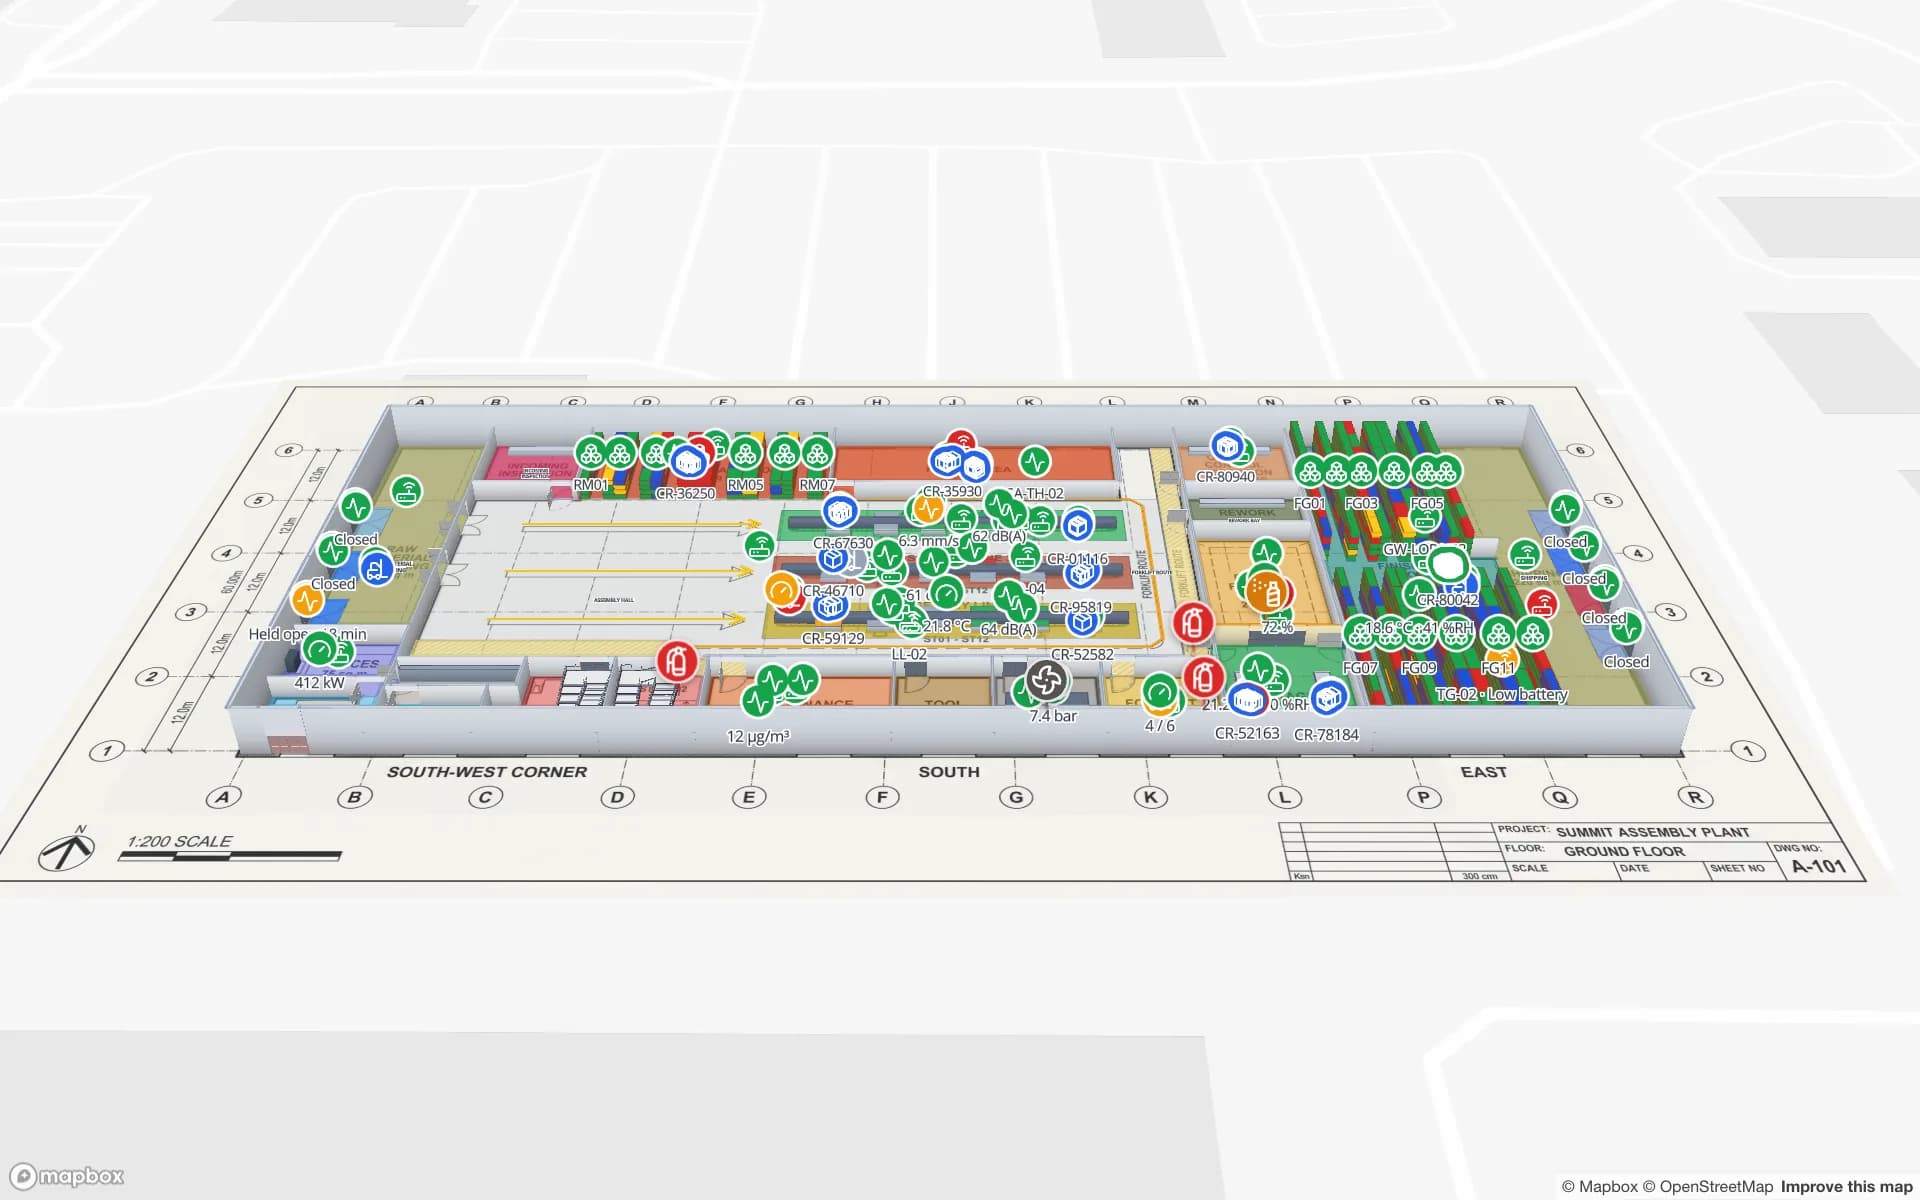
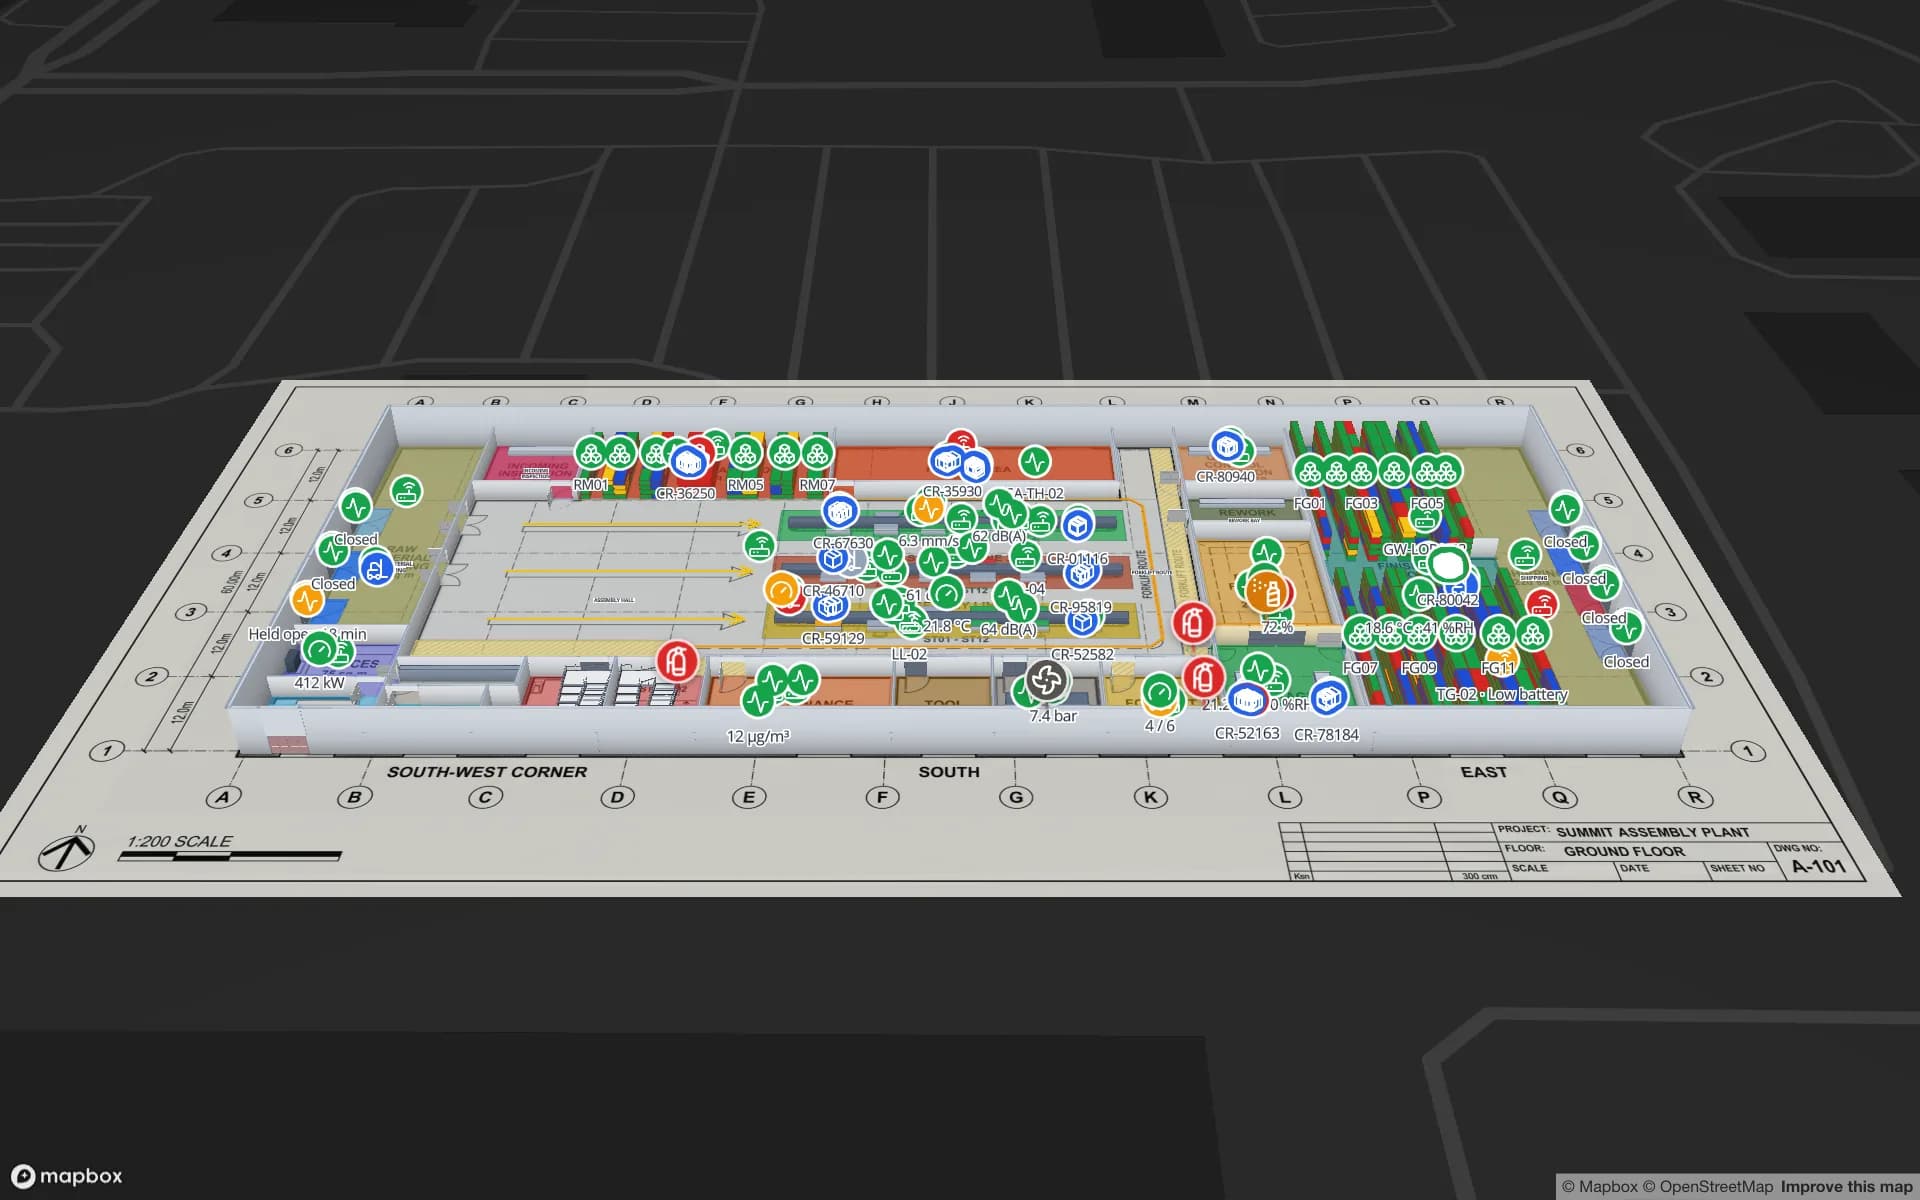
Summit Assembly Plant, a assembly plant demo, in the Spatial Map 3D viewer with live device markers
Summit Assembly Plant
Summit Assembly Plant, a demo plant: assembly lines and workstations, RFID WIP carriers and 867 raw-material and finished-goods rack locations.
Rack locations in the Summit Assembly demo plant
867
Interface language for Danish teams (Danish not available)
English
Software to install — runs in any modern browser
0
Free trial, up to 5 facilities
7 days

Pharmaceutical and life-sciences manufacturing

Denmark has a strong pharmaceutical and life-sciences sector, much of it on Zealand and in the Copenhagen area, which forms part of the Medicon Valley cluster with southern Sweden. Manufacturing sites keep raw materials in quarantine until released, store intermediates and finished product in controlled-temperature rooms, and restrict who can enter which area.

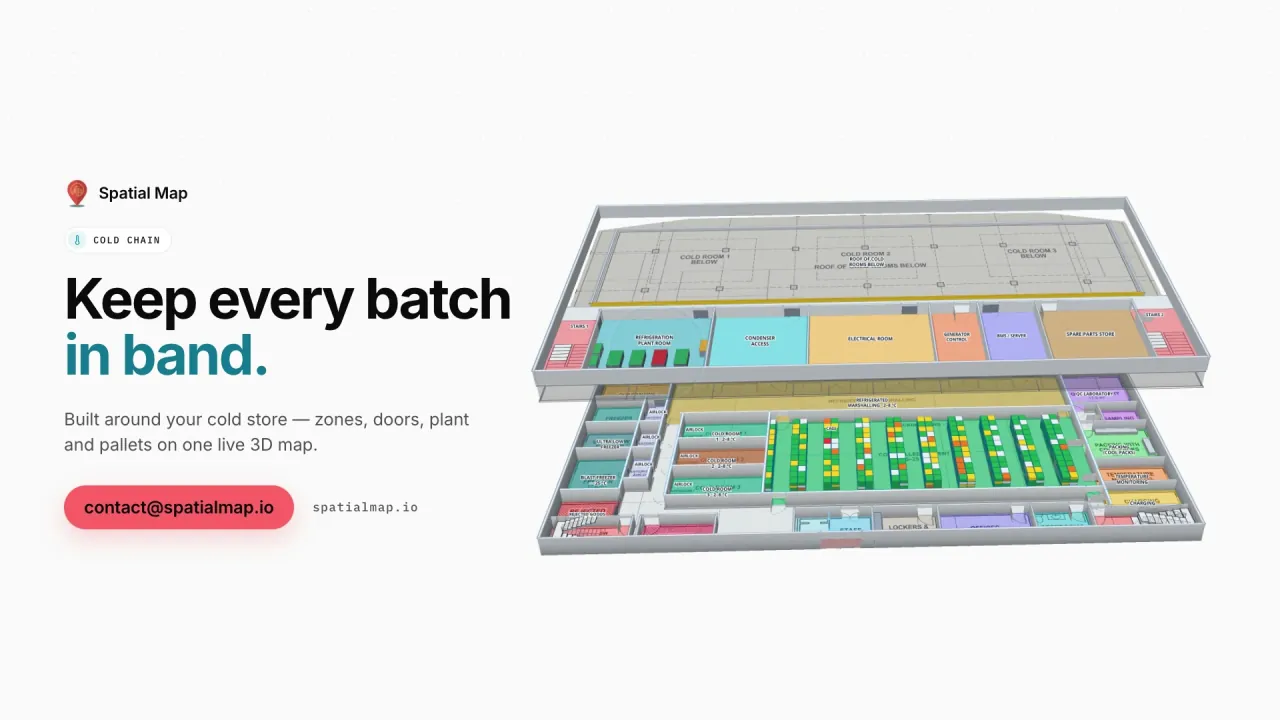
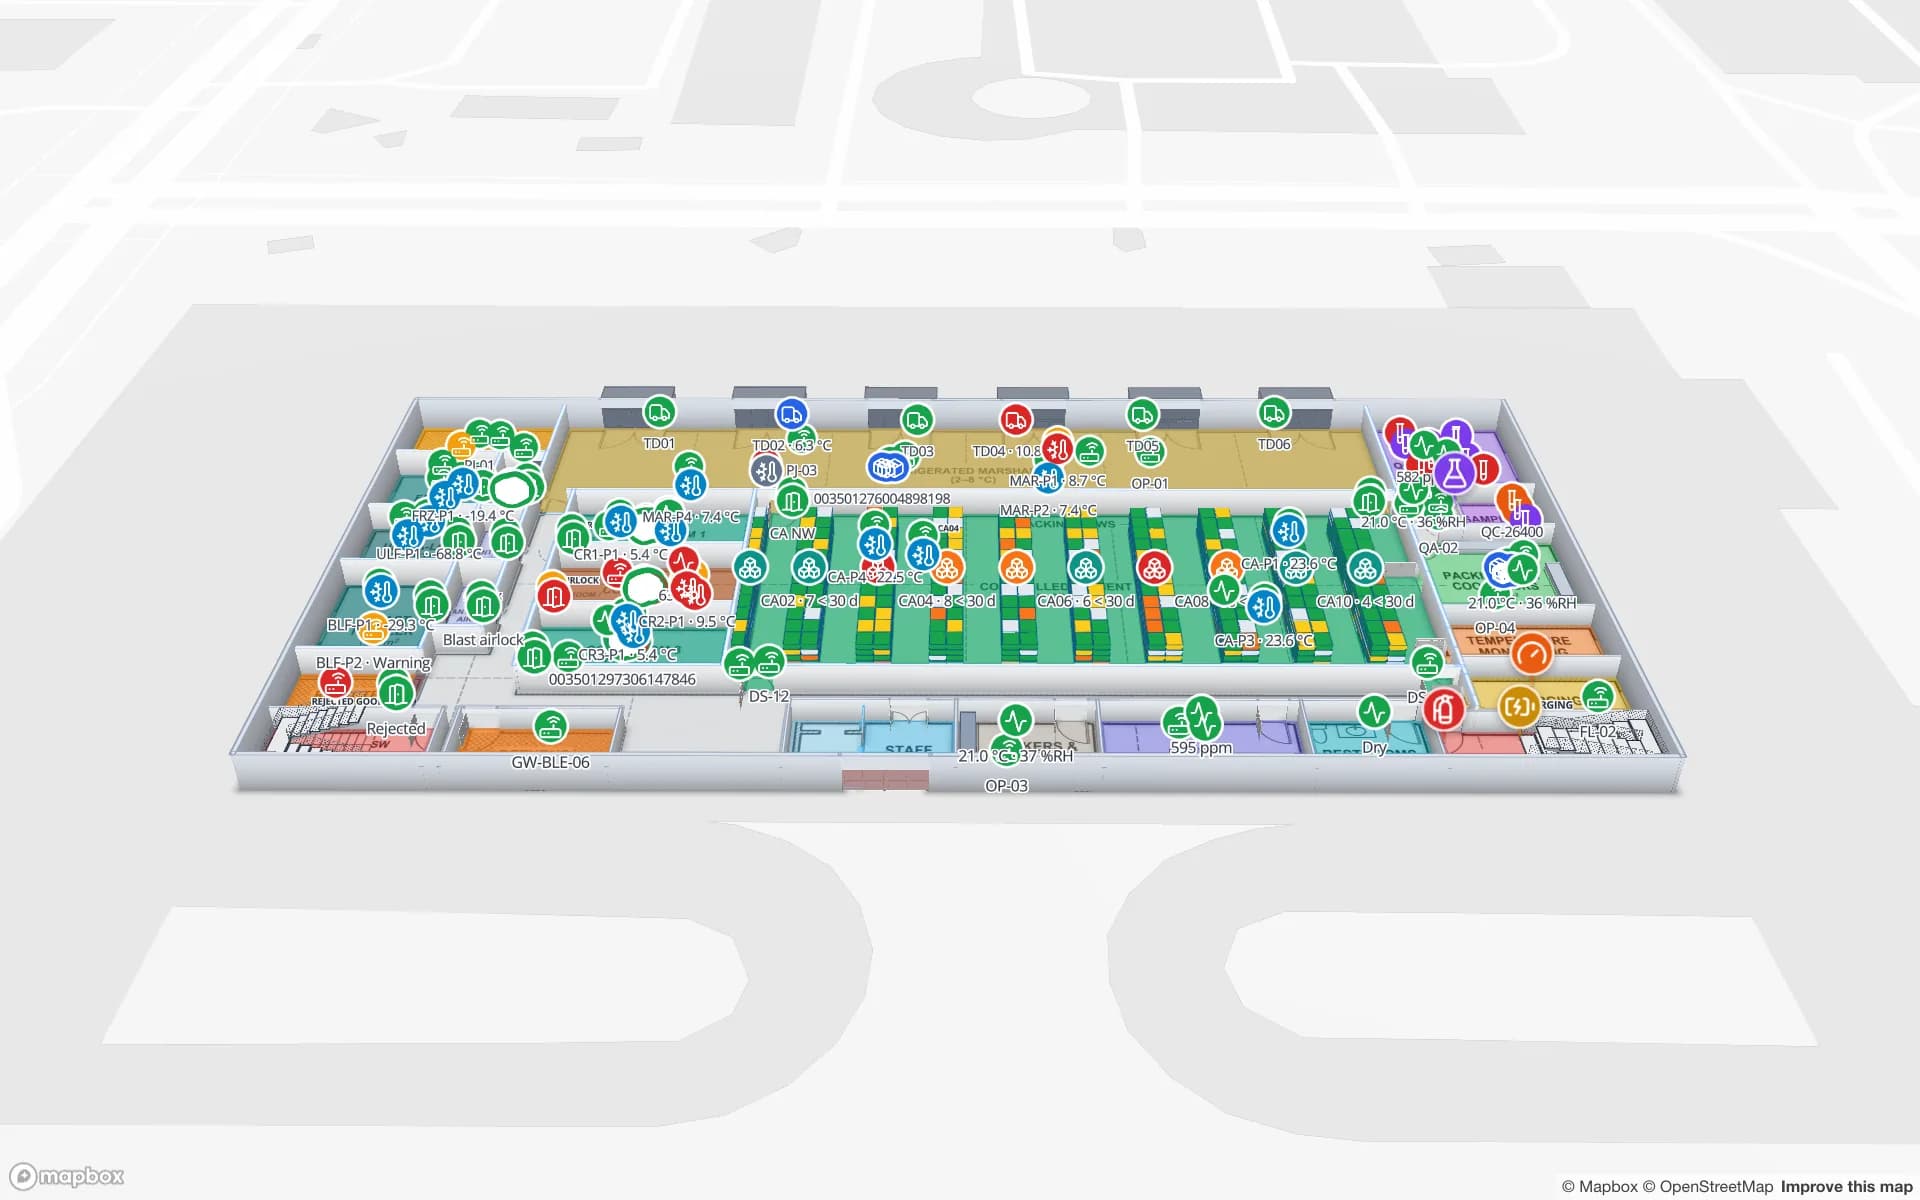
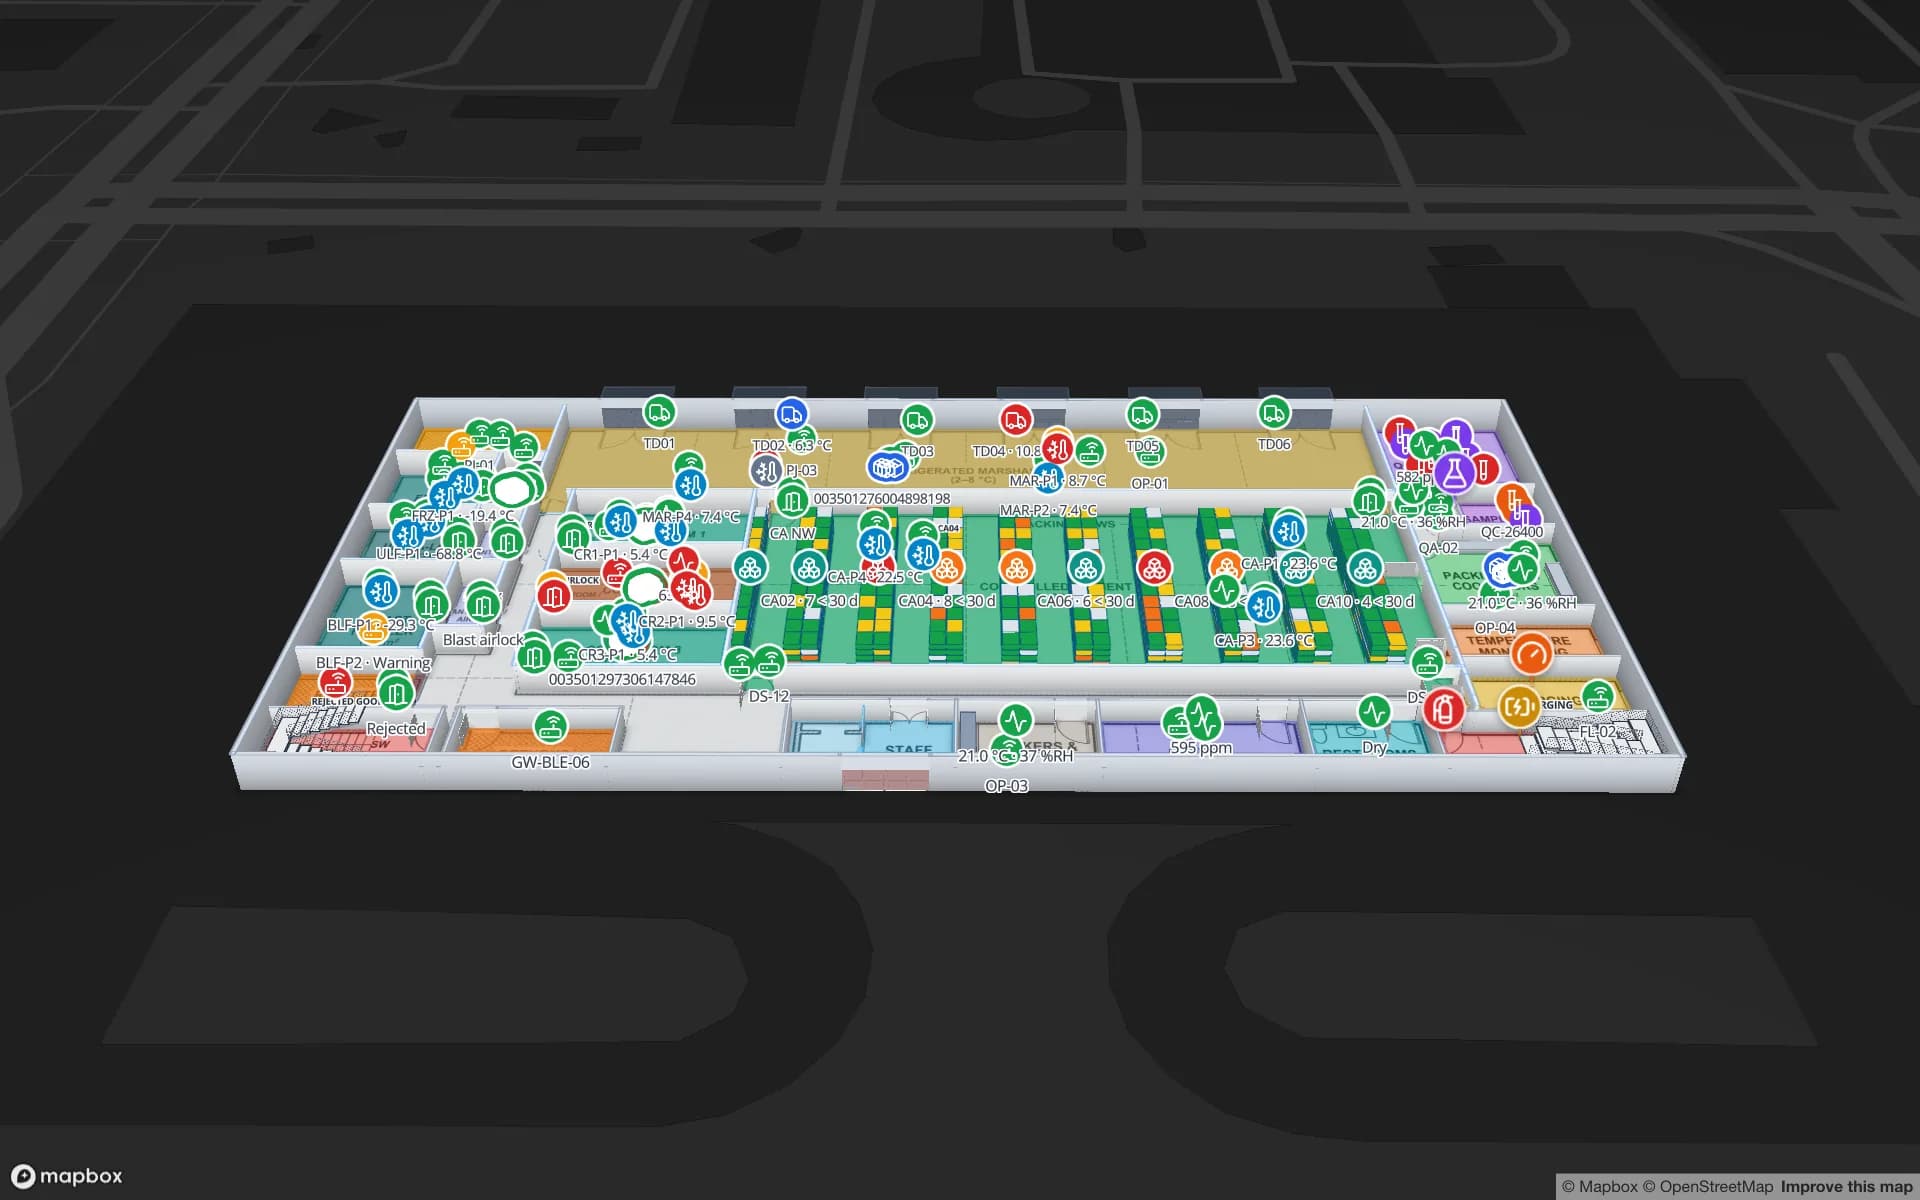
Spatial Map draws those areas on the site plan and colours them from your systems: quarantine, released and rejected stock by status, cold rooms and freezers by live temperature, doors by state. The work happens under EU GMP and GDP, and Spatial Map does not make anyone compliant; it makes the physical state visible, keeps row history you can replay, and exports reports for the QA file. The Polar Pharma demo shows cold rooms, quarantine, a QC laboratory and 1,140 rack locations.
Wind energy: components and logistics around Esbjerg

Denmark is one of the birthplaces of the modern wind industry, and blades, nacelles, towers and their many sub-components are still made and shipped from Danish sites. The Port of Esbjerg on the west coast is a major base for offshore wind, where very large components wait on the quay and in yards before installation vessels load them.

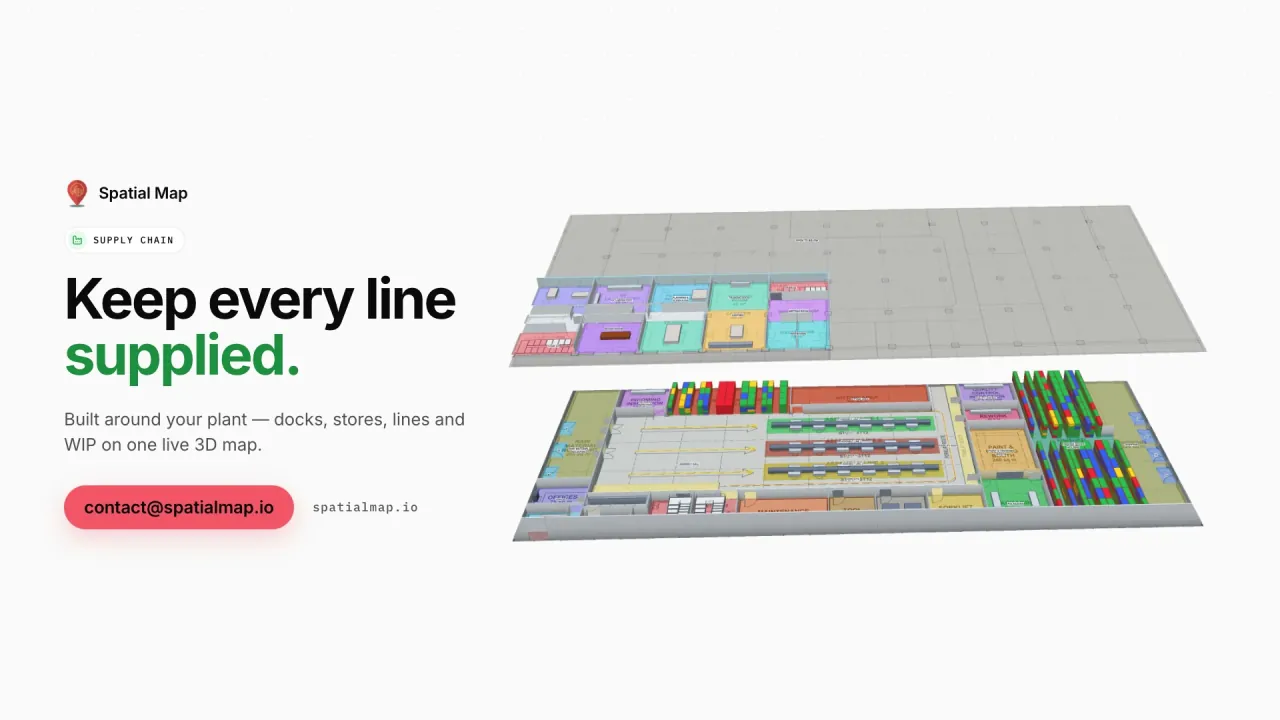
Very large items are tracked differently from pallets: they stand in numbered yard areas or hall bays, often with positions from a yard system or trackers on the cranes or components. Spatial Map draws those bays and yard areas on the site plan and shows whatever your system reports — a position as a live marker, or a bay assignment as a coloured area — next to the halls where sub-components are assembled. The Summit Assembly demo shows lines, work in progress and docks on one plant map.

Port of Aarhus, Copenhagen Airport and East Jutland

The Port of Aarhus is Denmark’s largest container port, and Copenhagen Airport is one of the busiest airports in the Nordic region, with air cargo alongside passenger traffic. Between them, logistics in East Jutland — notably the Triangle Region around Kolding, Fredericia and Vejle — serves Denmark and much of the wider Nordic market.

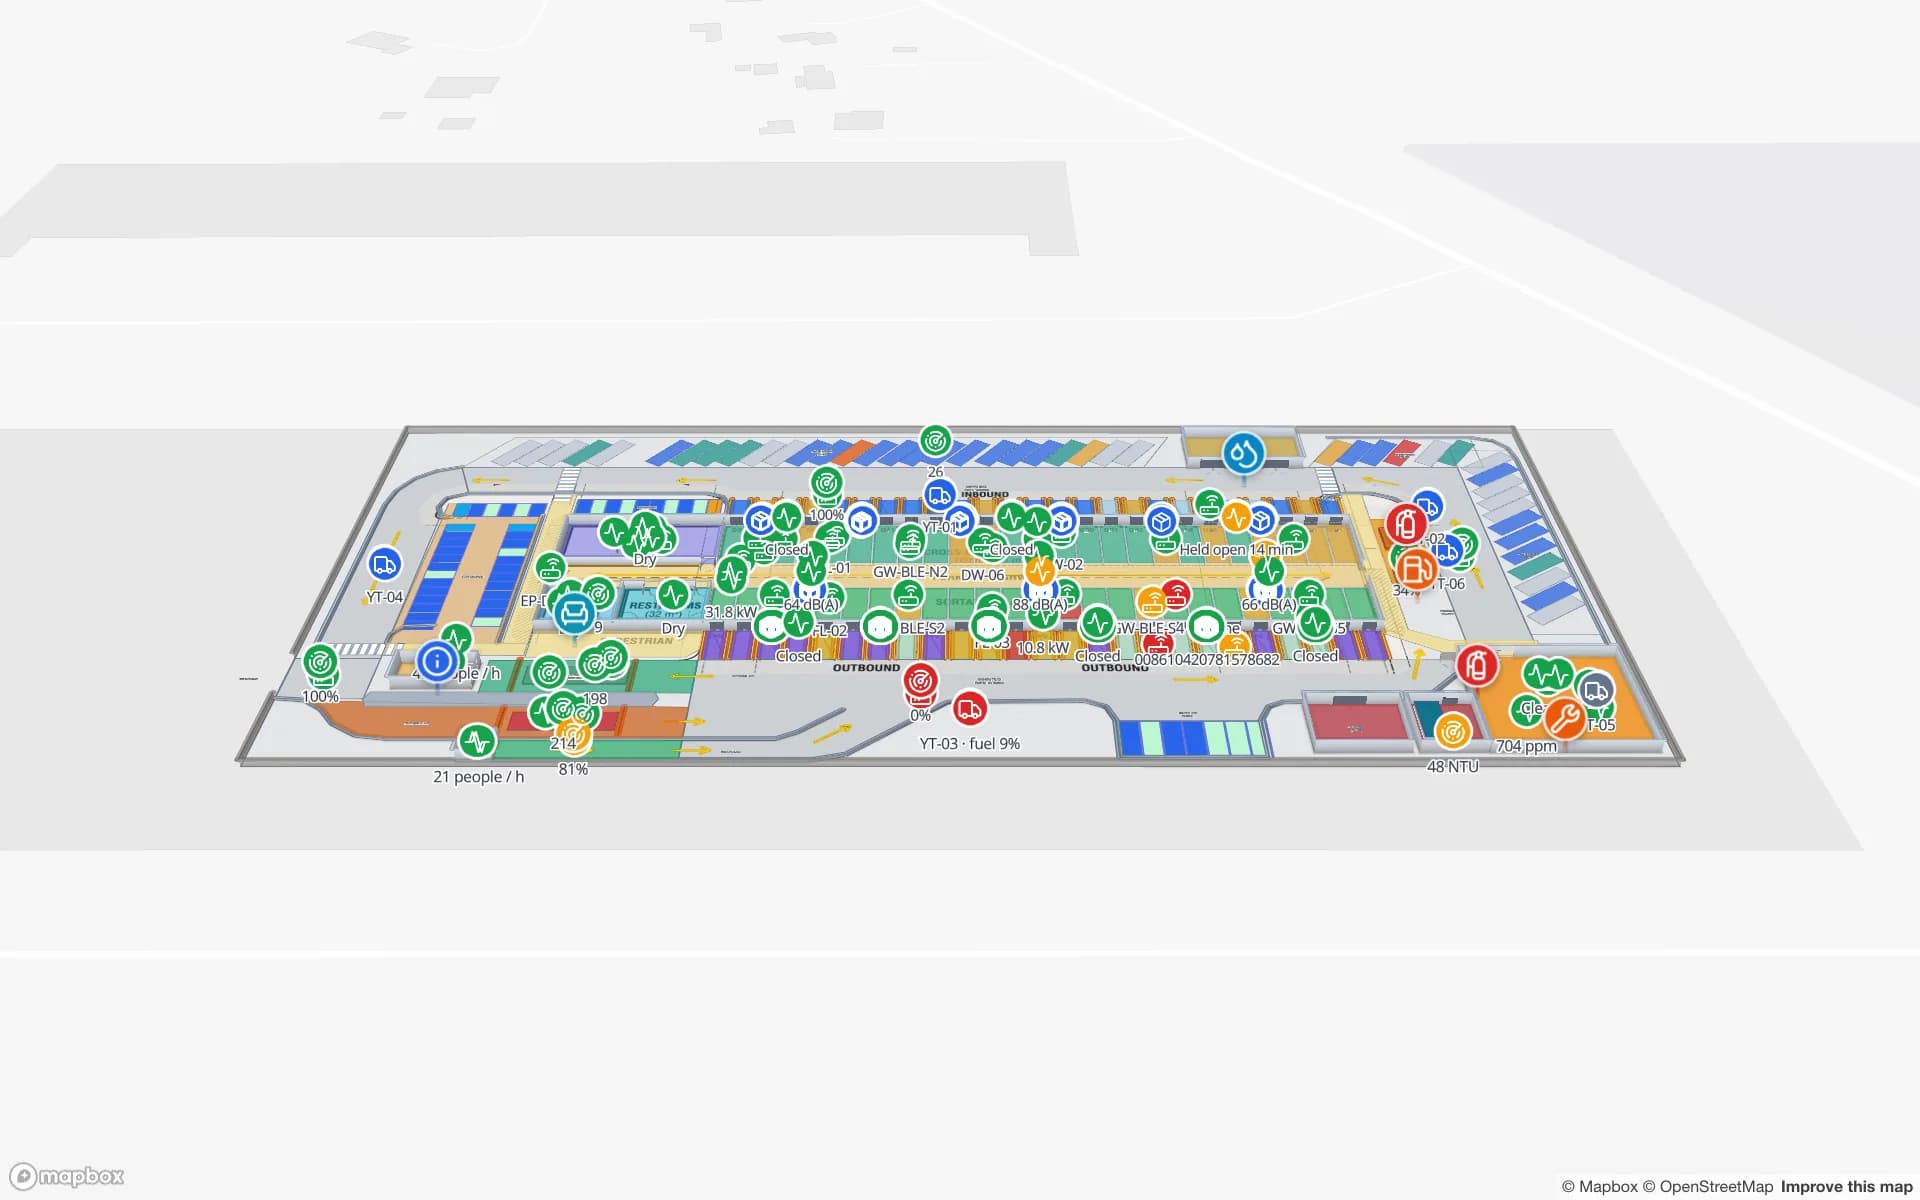
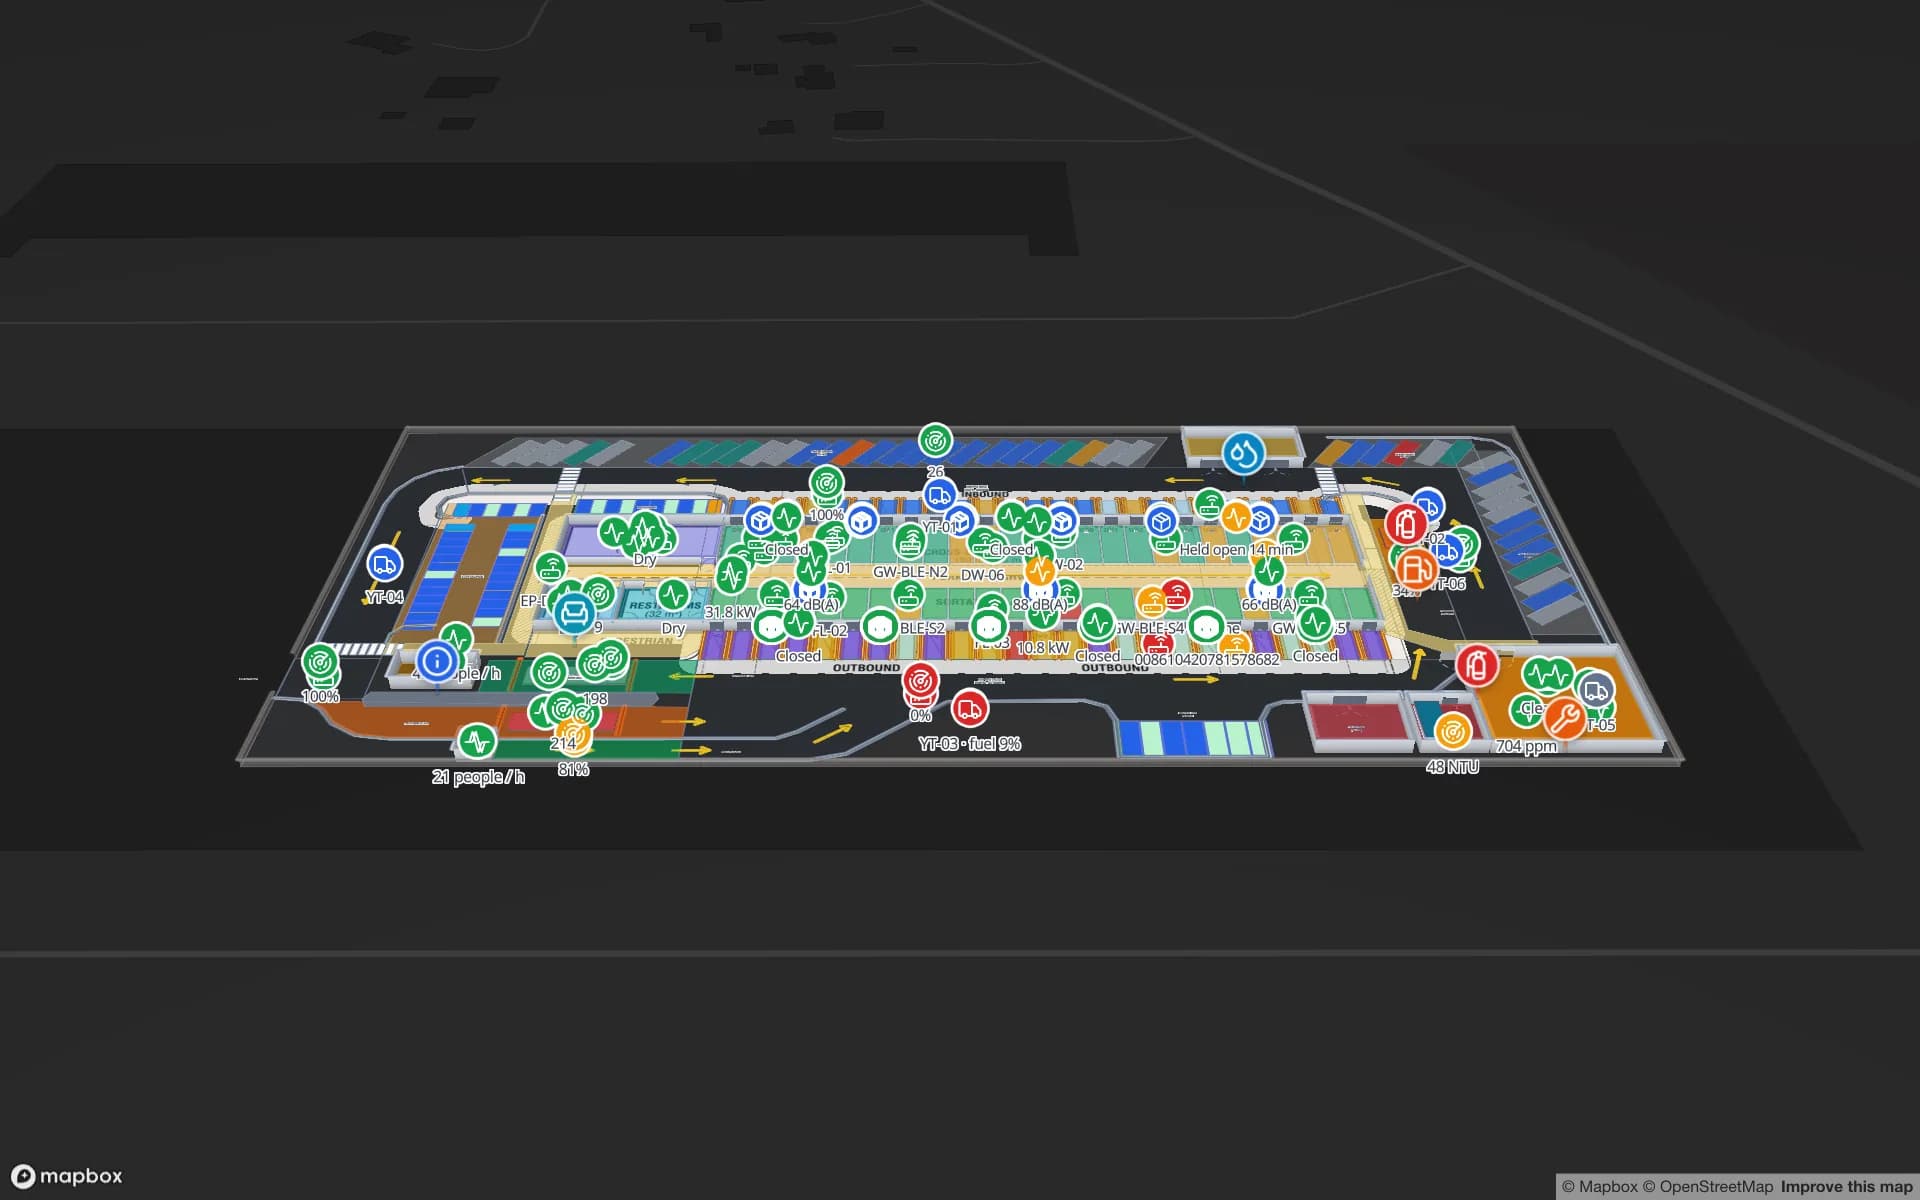
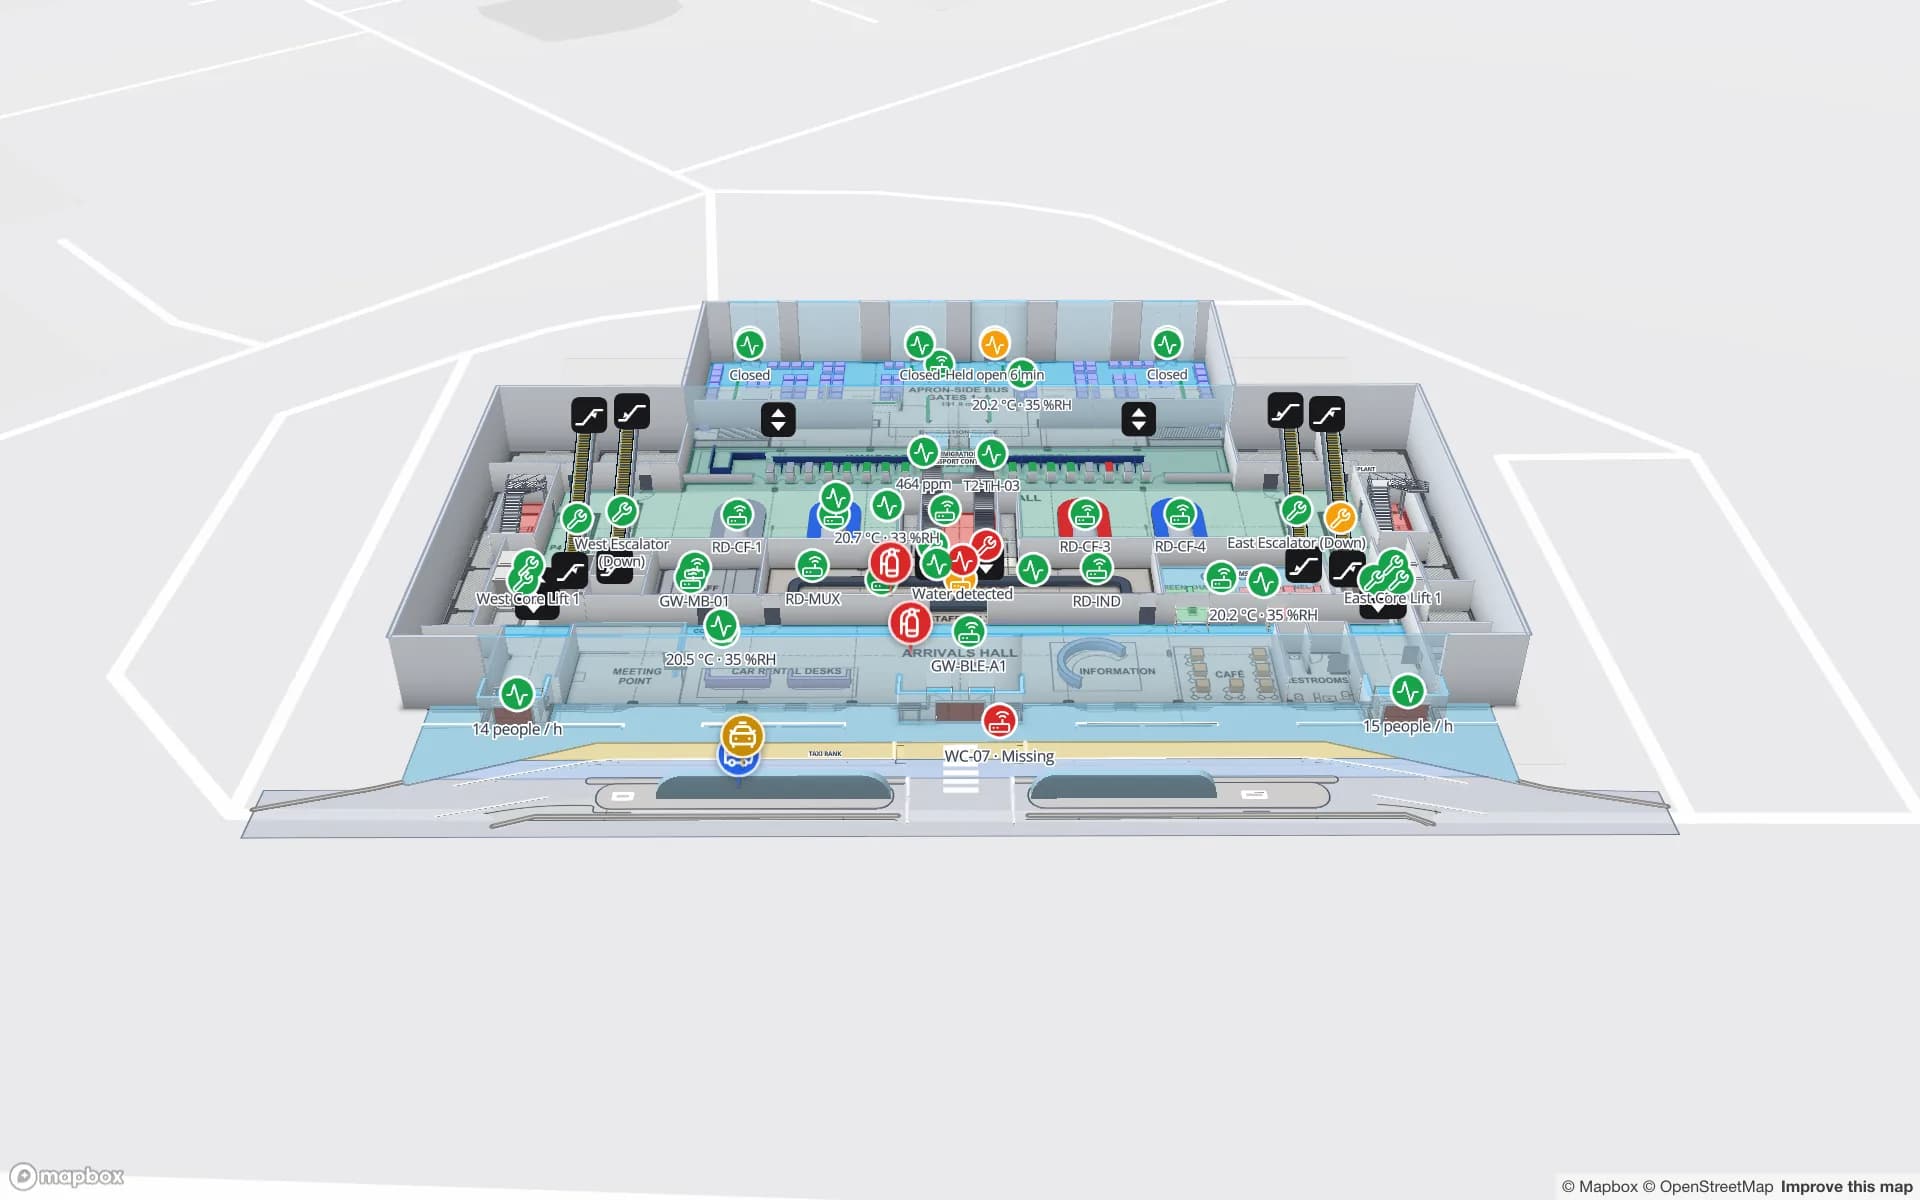
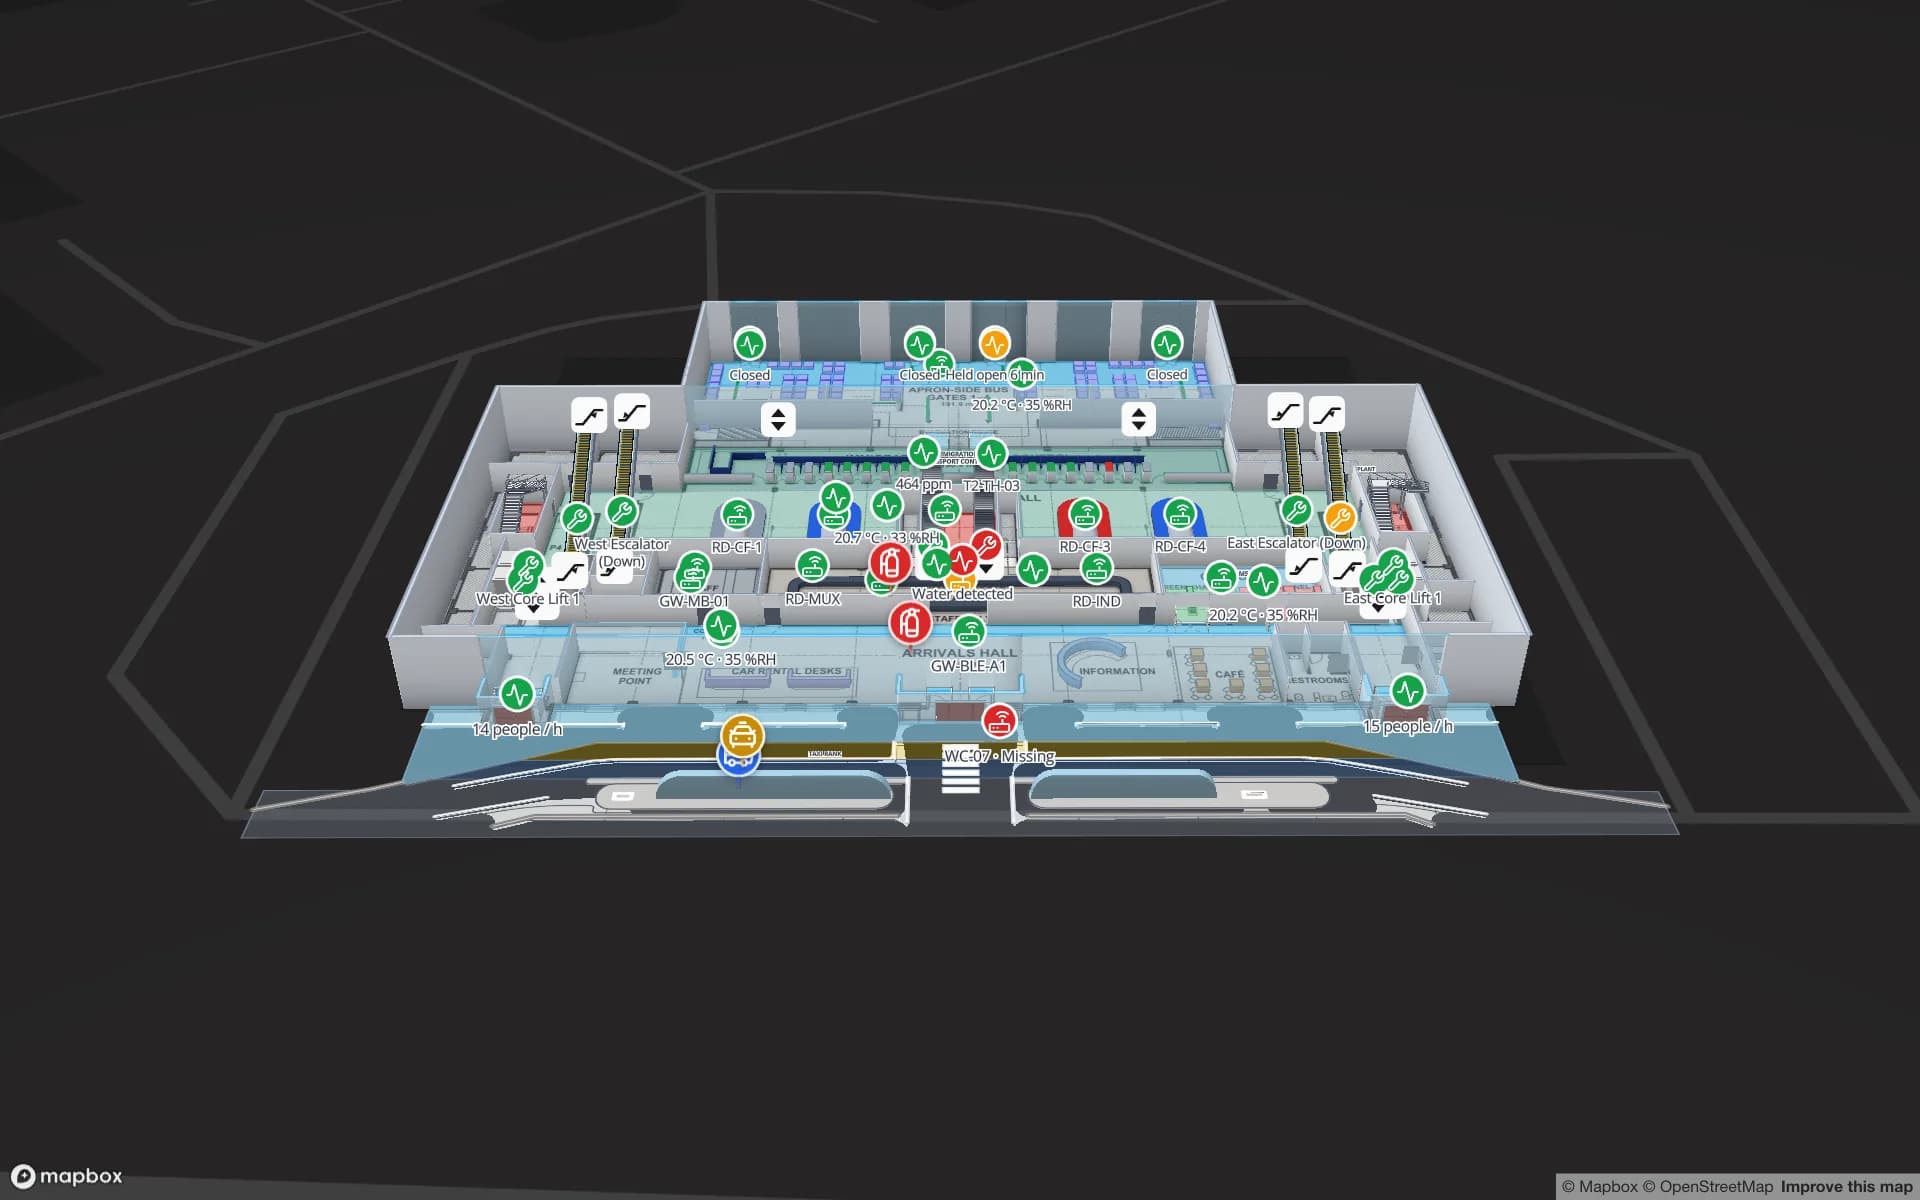
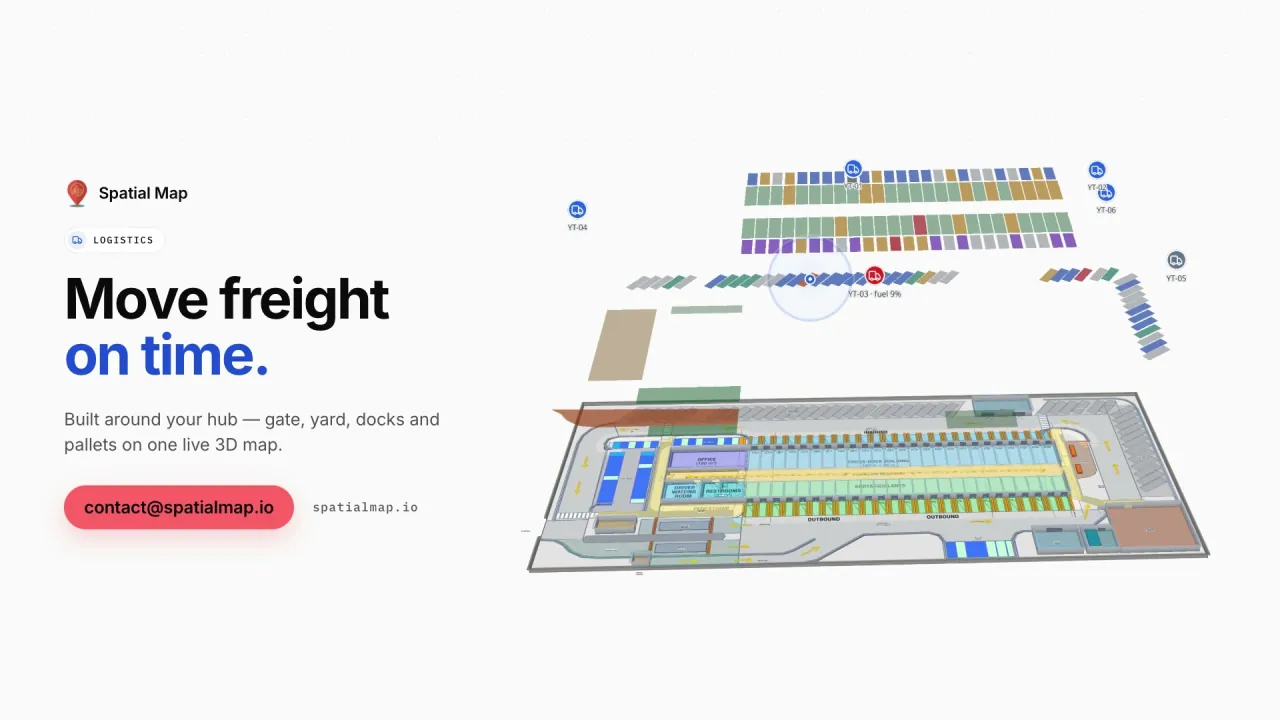
For cross-docks and distribution centres, Spatial Map shows dock doors, yard slots and pallets staged for the right outbound load; the Eastport Cross-Dock demo has 50 dock doors and 44 yard slots live. For terminals, the Silverbay Airport demo shows gates, queues and RFID bag tags on a terminal map.

Food exports: the pork and dairy cold chain

Denmark is a major exporter of pork and dairy products, and the chain behind them — slaughterhouses and cutting plants, dairies, cold stores and export terminals — runs on chilled and frozen rooms with doors opening all day. Spatial Map colours each room and reefer dock by the reading from your sensors, shows doors open or closed and pallets on hold, and replays the shift with the History player. The cold-chain solution shows how the pieces fit, and your quality procedures remain the record.

GDPR, language and working with us

Under the GDPR, location data that can be linked to an employee is personal data; Datatilsynet is the Danish supervisory authority. Danish collective agreements also contain rules on informing employees in advance about new control measures. Your legal advisers decide what applies to your project; most Danish projects start by tagging goods, components and equipment rather than people. A data processing agreement is available, and the security page explains how data is protected.

The interface is available in English, German, French, Spanish, Arabic and Chinese, not in Danish; Danish teams typically use it in English, while room names and report titles stay in Danish, æ, ø and å included. Spatial Map is sold online at the same USD price worldwide, and our team works with customers in Denmark remotely, by video call and through the contact form. Teams working across the border can also see the Germany page, where the interface is available in German.

How Spatial Map does it

From site plan to live plant map

  1. 01

    Import the site plan

    Upload plant, hall and yard drawings as PDF or DWG (AutoCAD R2004–R2018) and place them at real-world scale.

  2. 02

    Draw rooms, bays and yards

    Trace cold rooms, quarantine areas, assembly bays, numbered yard areas, racks and dock doors.

  3. 03

    Connect MES, ERP and sensors

    Your integration layer posts rows to a table with the write API, or Spatial Map polls its REST endpoint.

  4. 04

    Replay and report

    History playback, reports in PDF, Excel, CSV or JSON for QA, and read-only links for auditors or customers.

What Danish teams use it for

Pharma quarantine and cold rooms

Released, quarantined and rejected stock by status, cold rooms by temperature.

Wind-component halls and yards

Assembly bays and numbered yard areas coloured by what stands in them.

Port and cross-dock warehouses

Dock doors, yard slots and pallets staged for the right outbound load.

Airport terminals and cargo

Gates, queues and RFID bag tags on one terminal map.

Lifting gear and tools

Tagged tools, lifting gear and fixtures as live markers with row history.

See it on real demo facilities

Fictional names, real floor plans, live sensors, RFID, BLE tags and gateways — open any of them in the browser.

All 13 demo facilities

Questions from Danish teams

No. The app is available in English, German, French, Spanish, Arabic and Chinese, and Danish teams typically use it in English. Your own content — room names, bay numbers, report titles — can be in Danish.

No software does that on its own. Spatial Map shows live temperatures, door states and stock status on the map, keeps row history and exports reports; your quality system and procedures remain the record.

Yes, if a system reports where they are. Draw the yard areas and hall bays on the site plan; your yard system or tracking platform posts positions or bay assignments to a table, or exposes a REST endpoint Spatial Map polls, and each component appears as a live marker or in a coloured area.

That is for you and your legal advisers to decide: location data linked to a person is personal data under the GDPR, and Danish collective agreements contain rules on informing employees about new control measures. Most teams track goods and equipment first, and Spatial Map only shows the data you send it.

No. Spatial Map is sold online and our team works with Danish customers remotely, by video call and through the contact form.

The same worldwide, in US dollars: a 7-day free trial for up to 5 facilities, then Pro at $60 a month or $600 a year for up to 4 facilities. Larger estates are quoted as custom services.

Map your first Danish site this week.

Start the free trial, or send us a site plan and a sample of your MES, ERP or sensor data through the contact form.